NEW YORK — Silver is holding two contradictory narratives in the same price on Sunday. August nonfarm payrolls, released Friday, came in at 162,000 — nearly triple the consensus forecast of roughly 57,000 — and sent Fed rate-hike odds for the September 15-16 FOMC meeting to approximately 60 percent. That should be straightforwardly bearish for silver: a stronger economy, a harder Fed, a firmer dollar. Instead, US-Iran ship strikes over the weekend have introduced a geopolitical safe-haven bid that is keeping XAG/USD above $65. The result is spot silver at $65.90 on Sunday, down 0.47 percent from Friday’s close, with the market waiting to see which narrative wins when COMEX opens Monday.
COMEX is closed on Sunday. The $65.90 figure is an over-the-counter spot reference — the price at which silver is changing hands between institutional counterparties on metals trading desks that operate through the weekend. It is not a settlement price. COMEX’s last official session was Friday, when the December 2026 contract settled at approximately $66.35 per troy ounce, reflecting a slight contango premium over the spot close of $66.21.
The payroll report is the cleaner story. The Bureau of Labor Statistics reported 162,000 jobs added in August, a number that nearly tripled the roughly 57,000 that economists had penciled in. The dollar index strengthened on the data, Treasury yields moved higher, and the CME FedWatch tool’s implied probability for a rate hike at the September 15-16 meeting climbed to roughly 60 percent. That rate-hike channel is silver’s most direct transmission risk: a higher federal funds rate raises the opportunity cost of holding a non-yielding metal, and a firmer dollar makes dollar-denominated silver more expensive for overseas buyers.
Silver Price Today – September 7, 2026 (XAG/USD Spot)
| Metric | Value |
|---|---|
| XAG/USD Spot (Sept 7, OTC) | $65.90/oz |
| Change from Sept 5 Close | –$0.31 (–0.47%) |
| Sept 5 Close (last COMEX session) | $66.21/oz |
| Sept 4 Close | $66.67/oz |
| Sept 3 Close (Iran de-escalation) | ~$67.00/oz |
| Sept 2 Close (Iran escalation low) | $63.87/oz |
| Per Gram (spot) | ~$2.12/g |
| Per Kilogram (spot) | ~$2,119/kg |
| OTC spot reference for Sunday Sept 7, 2026. COMEX closed. Source: OTC metals market data. | |
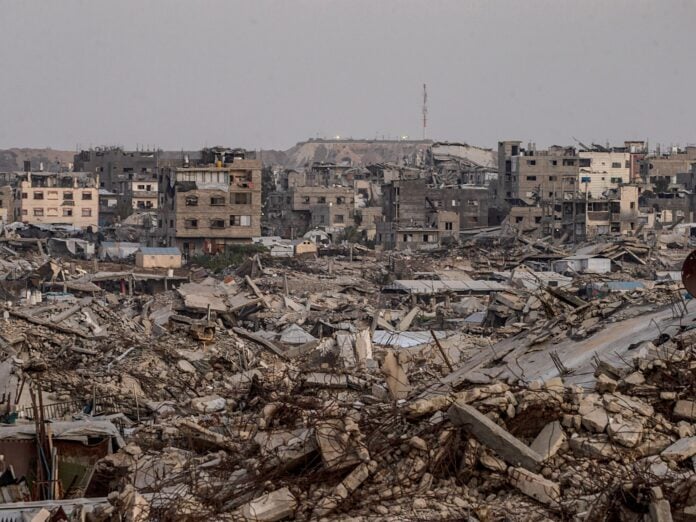
The complicating factor is geopolitics. US and Iranian naval assets exchanged fire in the Strait of Hormuz region over the weekend, adding a safe-haven premium that has limited silver’s post-NFP decline. It is not the first time this month that Iran has overridden the macro script: on Wednesday, September 3, silver jumped nearly 5 percent after President Trump signaled restraint on continued strikes, pulling XAG/USD from Tuesday’s low of $63.87 to an intraday high around $67.62. By Friday, the payroll data had pulled it back to $66.21. The weekend ship strikes have reopened that geopolitical variable just as the monetary one was starting to dominate.
What sets Sunday’s price apart from last week’s moves is that the two forces are now working in opposite directions simultaneously rather than sequentially. The NFP beat argues for $62-64 silver if the Fed hikes. The Iran escalation argues for a return toward $67 if the conflict widens. The $65.90 spot price is what the market produces when neither narrative has yet proved itself correct.
COMEX Silver December Futures – Last Session Sept 5, 2026
| Contract | Last Settlement | Prior Session (Sept 4) |
|---|---|---|
| December 2026 | ~$66.35/oz | ~$66.67/oz |
| March 2027 | ~$66.65/oz | — |
| Spot Reference (OTC) | $65.90/oz | Sunday Sept 7 |
| COMEX closed Sunday Sept 7. Last official session: Friday Sept 5. Approximate settlement prices. Source: CME Group. | ||
10-Day XAG/USD Trend
| Date | XAG/USD | Daily Change |
|---|---|---|
| Sep 7, 2026 (Sun) | $65.90 | –0.47%* |
| Sep 5, 2026 (Fri) | $66.21 | –0.69% |
| Sep 4, 2026 (Thu) | $66.67 | –0.49% |
| Sep 3, 2026 (Wed) | ~$67.00 | +4.90% |
| Sep 2, 2026 (Tue) | $63.87 | –2.58%† |
| Aug 29, 2026 (Fri) | ~$65.57 | est. |
| Aug 28, 2026 (Thu) | ~$65.77 | est. |
| *OTC spot; COMEX closed Sunday. †Sept 1 was US Labor Day (COMEX closed); Sept 2 change calculated vs Aug 29 estimate. Pre-Sept 2 prices are OTC reference estimates. Source: CME Group / OTC metals market. | ||
NY Fed President Williams noted in early September that energy prices do not appear to be spilling into underlying services inflation, which had given the Fed some analytical breathing room before the payroll data arrived. That room has now narrowed sharply. At 162,000, August payrolls are strong enough to justify the rate hike that markets had been pricing at roughly 30 percent before the report. A 60 percent implied probability heading into September 15-16 is not certainty, but it is close enough that silver’s current price needs to account for meaningful hike risk.
US Macro Context – September 7, 2026
| Indicator | Value | Note |
|---|---|---|
| Aug NFP (released Sept 5) | +162,000 | Vs ~57,000 expected; ~3x forecast |
| Fed Hike Probability (Sept 15-16) | ~60% | CME FedWatch post-NFP |
| US Dollar (DXY) | Strengthened | Post-NFP dollar bid |
| 10-Year Treasury Yield | Higher | Rose on jobs beat |
| US-Iran Ship Strikes (Sept 6-7) | Active | Geopolitical floor for metals |
| Next FOMC Decision | Sept 15-16 | Key event for XAG/USD direction |
| Sources: Bureau of Labor Statistics; CME Group FedWatch; Federal Reserve. | ||
Silver’s position in the current cycle makes the rate-hike risk sharper than it might otherwise appear. XAG/USD is up roughly 60 percent year-to-date in 2026, rising from around $41 at the start of the year to the current $65.90 level. Much of that gain was built on the thesis that the Federal Reserve would hold rates steady or cut, supporting a weakening dollar and boosting precious metals. The August payroll report puts that thesis under direct pressure. The September 3 Iran de-escalation surge pushed silver to an intraday high of approximately $67.62 — the 52-week high — and much of that gain has since been given back. Whether the Iran conflict deepens over the coming week will determine whether the geopolitical premium returns or the rate-hike fear takes over.
International Silver Market Context
| Metric | Value | Note |
|---|---|---|
| XAG/USD Sept 7 (OTC spot) | $65.90/oz | –0.47% from Sept 5 close |
| 2026 YTD Performance | ~+60% | From ~$41 Jan 1 open |
| 52-Week Low | ~$38.00/oz | September 2025 |
| 52-Week High | ~$67.62/oz | Sept 3, 2026 (Iran de-escalation) |
| Gold/Silver Ratio | ~48:1 | Silver outperforming gold YTD (est.) |
| Silver YTD Bull Cycle | Intact | Despite near-term rate headwinds |
| OTC spot data. YTD and 52-week figures are reference estimates. Source: OTC metals market / CME Group. | ||
The September 15-16 FOMC meeting is the decisive near-term event for silver. A 25-basis-point hike would likely push XAG/USD toward the $62-64 range, unwinding most of September’s recovery and testing the summer floor. A hold — particularly if accompanied by cautious language on the economic outlook — could see silver test $67 again, especially if the Iran situation remains active. The question the market has not yet answered is which of the two surprises it has received this week — the jobs beat or the ship strikes — is actually the more durable one. As of Sunday evening, it has answered neither.
Frequently Asked Questions
What is the silver price today on September 7, 2026?
The OTC spot price for silver on September 7, 2026 is $65.90 per troy ounce, down 0.47 percent from Friday’s close of $66.21. COMEX is closed on Sunday; $65.90 is an over-the-counter reference price, not an exchange settlement.
Why did silver fall on September 7?
August nonfarm payrolls, released Friday September 5, came in at 162,000 — nearly three times the roughly 57,000 consensus forecast. The strong jobs data strengthened the dollar and lifted Federal Reserve rate-hike odds to approximately 60 percent for September 15-16, weighing on XAG/USD.
What is COMEX silver trading at today?
COMEX is closed Sunday September 7. The last official session was Friday September 5, when the December 2026 contract settled at approximately $66.35 per troy ounce. Trading resumes Monday morning Eastern Time.
Why are US-Iran ship strikes relevant to silver prices?
Geopolitical conflict in or near the Strait of Hormuz raises energy-price and inflation risk, which supports precious metals as safe-haven assets. The weekend exchanges between US and Iranian naval forces have provided a partial floor under silver, limiting the post-NFP decline.
What is the Federal Reserve expected to do on September 15-16?
CME FedWatch implied probabilities put the chance of a 25-basis-point rate hike at roughly 60 percent following the August payroll beat. A hike would strengthen the dollar and raise the opportunity cost of holding non-yielding silver.
Is silver up for the year?
Yes. Silver is up approximately 60 percent year-to-date in 2026, rising from around $41 per ounce at the start of the year to the current $65.90 level. The 52-week high was approximately $67.62, reached September 3 during the Iran de-escalation rally.
What drives silver prices in the United States?
US silver prices are driven by Federal Reserve monetary policy expectations, dollar strength (DXY), geopolitical risk premiums, industrial demand from the electronics, solar, and medical sectors, and investment flows into silver ETFs and COMEX futures. When the monetary and industrial demand drivers diverge — as they are now — the result is the kind of compressed, range-bound price action silver is showing this weekend.
Closing Update – Market Open
This article will be updated with official COMEX settlement data when markets open Monday, September 8, 2026.