
NEW YORK — Silver buyers comparing offers across countries face a problem that the headline price alone cannot resolve: a wholesale ounce in dollars is not the same transaction as a tax-inclusive kilogram from a local dealer. The latest available November 19 observations show why the quotation time, purity and final charges matter as much as the currency figure.
Silver Price Today references in this report include a US quotation of $45.26 per troy ounce at 6 a.m. Eastern Time on November 19 and an Indian indicative rate of ₹180 per gram. Neither should be presented as a November 20 opening price. The regional observations below were collected at different times and are not a synchronized global price comparison.
For a buyer deciding between a bar, coin or jewellery item, the practical question is what the final invoice contains and what a dealer would pay to buy it back. This report separates published metal references from transaction prices; it does not establish where silver can be bought most cheaply.
Fortune’s November 19 silver report placed the metal at $45.26 per ounce at 6 a.m. ET, 48 cents below its previous-day comparison of $45.74. This is an explicitly timed morning observation, not a closing price or a claim about the market’s latest tick.
In India, Groww’s own silver-rate page, dated November 19, displayed ₹180 per gram for 999-purity silver and ₹1,80,000 per kilogram. Its daily series showed ₹185 per gram on November 18. Those figures describe the platform’s published indication, not a guaranteed executable offer from every jeweller.
| Market | Currency | Reference | Observation time, ET |
|---|---|---|---|
| United States | USD | 45.26 per troy ounce | 6:00 a.m. |
| India | INR | ₹180 per gram; ₹1,80,000 per kilogram | November 19 daily rate; time unspecified |
| Euro market | EUR | 41.24 per troy ounce | 5:14 a.m. |
| United Kingdom | GBP | 34.49 per troy ounce | 5:14 a.m. |
| United Arab Emirates | AED | 5.23 per gram | 12:18 p.m. |
| Saudi Arabia | SAR | 5.34 per gram | 2:20 p.m. |
| Qatar | QAR | 5.32 per gram | 9:50 a.m. |
| Kuwait | KWD | 0.4455 per gram | 1:48 p.m. |
| Sources: Fortune, Groww, BullionVault, GoldPriceZ and LivePriceOfGold. November 19 observations at different times; not dealer offers. European and Gulf snapshots require rechecking before publication. Times are Eastern Standard Time. | |||
The Indian indication works out to ₹1,800 for 10 grams and ₹18,000 for 100 grams. Groww says its page shows a benchmark rate and that the final purchase price can vary with product form, jeweller premium, making charges, GST and the local market spread. Its figures therefore should not be labelled the final cost of a finished product.
The distinction also prevents a misleading country ranking. Converting a dollar reference into rupees is not enough to reconstruct an Indian retail invoice. Groww identifies exchange rates, global prices, import duties, taxation and local demand among the influences on domestic quotations. A comparison needs equivalent weight, purity, transaction time and included charges.
The draft’s European observation comes from BullionVault’s silver-price chart: €41.24 per troy ounce, €1.33 per gram and €1,326 per kilogram at 5:14 a.m. ET on November 19. Its corresponding sterling snapshot was £34.49 per troy ounce, £1.11 per gram and £1,109 per kilogram. These are retained reference observations requiring a fresh check before publication, not live retail offers.
A euro-denominated reference does not establish a single shop price across Europe. Nor does the sterling value describe every British dealer’s offer. Product premiums, delivery costs and applicable tax treatment must be identified separately; the table does not provide enough information to compare final purchase costs between jurisdictions.
| Market and currency | Per gram | Per troy ounce | Per kilogram |
|---|---|---|---|
| UAE, AED | 5.23 | 162.63 | 5,228.63 |
| Saudi Arabia, SAR | 5.34 | 166.16 | 5,342.47 |
| Qatar, QAR | 5.32 | 165.45 | 5,319.40 |
| Kuwait, KWD | 0.4455 | 13.8555 | 445.46 |
| Sources: LivePriceOfGold for UAE, Qatar and Kuwait; GoldPriceZ for Saudi Arabia. Retained snapshots requiring re-verification before publication. See the first table for individual observation times. Independent display rounding can produce small conversion differences. | |||
The UAE reference page supplied the AED snapshot, while GoldPriceZ’s Saudi Arabia page supplied the SAR values. The Gulf table also retains separately timed observations from the Qatar silver-rate page and Kuwait silver-rate page. These pages change, so a reader opening them later may see different figures.
A separately timed Dubai quotation cannot establish a discount relative to the wider UAE reference. The same limitation applies when comparing Gulf countries: the displayed currencies and decimal precision differ, and the observations were not simultaneous. No tax-inclusive dealer basket has been collected for this report.
Fortune explains that physical buyers generally face premiums above spot for markups, shipping and insurance. It also distinguishes the dealer’s ask, the price to buy, from the bid, the amount received when selling. That spread matters: even an unchanged metal benchmark does not mean a buyer could immediately recover the full purchase price.
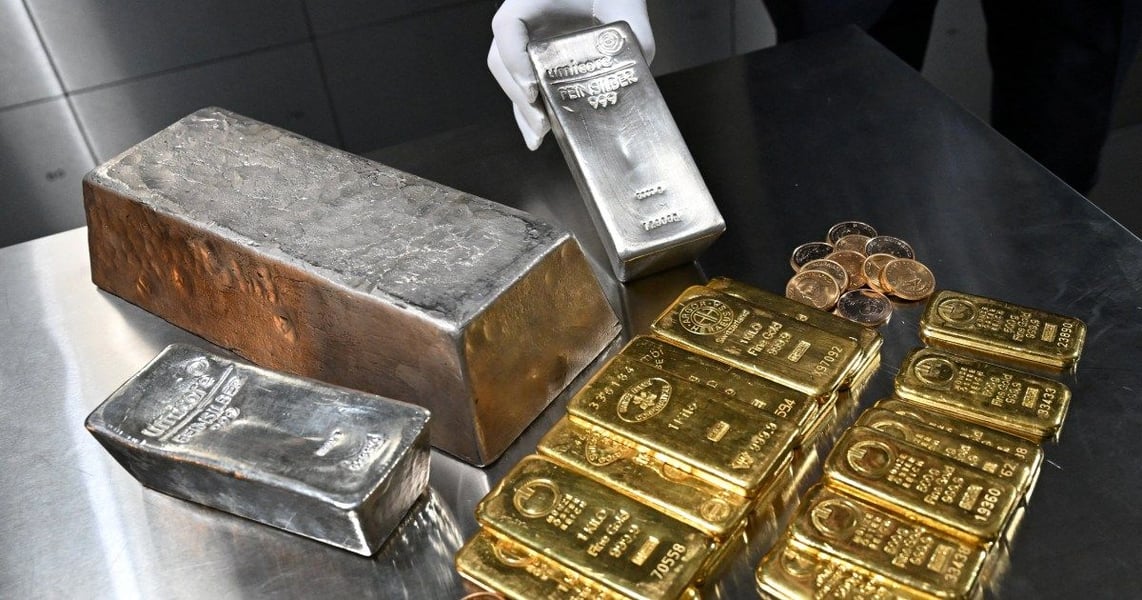
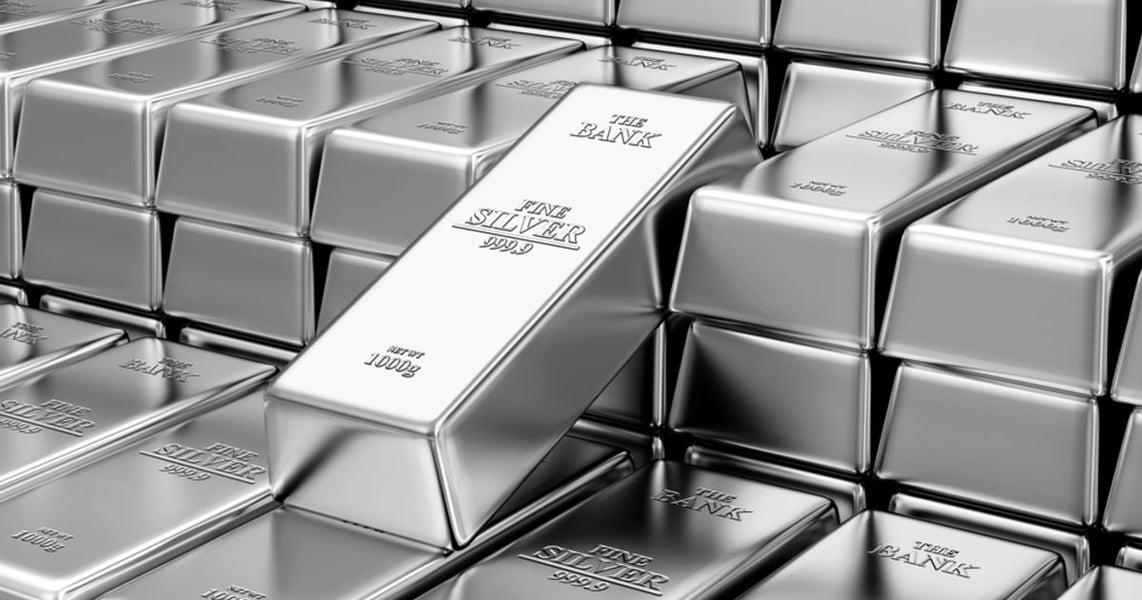
Weight and purity require equal care. A precious-metals troy ounce is approximately 31.1035 grams. The 999 and 925 markings denote 99.9% and 92.5% silver content respectively, so equal gross weights do not represent equal fine-silver content. Design and manufacturing costs can further separate jewellery prices from bullion values.
The Eastern Herald’s bullion coverage, precious metals news and commodities coverage provide broader market context. The unresolved comparison here is narrower: an itemized local selling price and a matching buyback bid are still needed before these reference figures can describe the cost of an actual purchase.