
NEW YORK — The Federal Reserve hiked rates on Tuesday. Saudi Arabia partially restored its pipeline on Wednesday. Silver chose the second story.
XAG/USD climbed to $64.40 per troy ounce on September 17, a gain of $0.81 or 1.27 percent from the prior session’s close of $63.59, as oil prices corrected after Saudi Arabia reported partial restoration of capacity on its East-West crude pipeline. The pipeline had been damaged in drone strikes earlier in the week; its recovery removed the clearest energy-supply-chain argument for another Fed hike above the 3.75 to 4.00 percent level delivered just 24 hours earlier. Silver, which had been punished in anticipation of that hike, caught the reversal.
The mechanics deserve spelling out because they are not obvious. Silver is not an oil asset. But the argument for a second Fed hike this cycle rested partly on August’s 3.4 percent annual inflation print, which was driven by a 27.4 percent year-over-year surge in gasoline prices. Remove the energy channel — or at least reduce it — and the path from current inflation to 4.1 percent on Fed Chair Kevin Warsh’s updated dot plot becomes less certain. That uncertainty is what the oil-price decline bought silver on Thursday.
Silver Price Today – XAG/USD Spot (September 17, 2026)
| Session Data | Value |
|---|---|
| Sep 17 (approx) | $64.40/oz |
| Sep 17 Intraday Range | $63.44–$64.93 |
| Sep 16 Close (post-Fed hike) | $63.59 |
| Day Change | +$0.81 (+1.27%) |
| Sep 15 Close (pre-FOMC) | $66.74 |
| 2-Day Change (Sep 15–17) | −$2.34 (−3.51%) |
| Sep 8 Iran-Driven High | ~$66.92 |
| Sep 10 Cycle High | $67.92 |
| XAG/USD spot price. Source: Investing.com / FXStreet, September 17, 2026. | |
The recovery does not undo Tuesday’s damage. XAG/USD closed September 16 at $63.59, nearly $3.15 below the pre-FOMC level of $66.74. Warsh’s press conference extended the losses beyond what a 25-basis-point hike alone would typically cause, because the dot plot’s median 2026 projection moved to 4.1 percent from the previous 3.8 percent — signaling that the committee sees at least one additional hike as the central case, not a tail risk. That message is still operative. Thursday’s recovery reflects traders taking down short positions on reduced energy-inflation pressure, not a change in the Fed’s direction.
COMEX December silver futures tracked the spot move closely, rising to approximately $64.65 per troy ounce — a small premium to spot that reflects the cost of carry through the December contract. Open interest in silver futures remains elevated after the September FOMC decision, consistent with a market that repriced aggressively but has not yet committed to a sustained recovery move. The next major anchor is the October 14 CPI release, which will carry September’s inflation data and effectively set the table for the November FOMC meeting.
COMEX Silver December Futures – September 17, 2026
| Item | Value |
|---|---|
| Exchange | COMEX (CME Group) |
| Contract | December 2026 |
| Sep 17 (approx) | ~$64.65/oz |
| Day Change | +~$0.80 (+1.25%) |
| Sep 16 Close | ~$63.85/oz |
| Premium to Spot | ~$0.25/oz |
| Next Major Anchor | October 14 CPI |
| COMEX Dec 2026 silver futures. Small premium to spot reflects cost of carry. Source: CME Group / Investing.com, September 17, 2026. | |
10-Day XAG/USD Price Trend
| Date | XAG/USD Close | Change |
|---|---|---|
| Wed, Sep 17 | $64.40 | +$0.81 (+1.27%) |
| Tue, Sep 16 | $63.59 | −$3.15 (−4.72%) |
| Mon, Sep 15 | $66.74 | −$0.18 (−0.27%) |
| Fri, Sep 12 | $66.92 | −$0.28 (−0.41%) |
| Thu, Sep 11 | $67.20 | −$0.72 (−1.06%) |
| Wed, Sep 10 | $67.92 | +$1.00 (+1.49%) |
| Tue, Sep 9 | $66.92 | +$1.00 (+1.52%) |
| Mon, Sep 8 | $65.92 | +$2.33 (+3.66%) |
| Fri, Sep 5 | $66.21 | +$0.54 (+0.82%) |
| Thu, Sep 4 | $66.67 | +$2.80 (+4.39%) |
| XAG/USD spot close. Sep 13–14: weekend. Source: Investing.com, September 17, 2026. | ||
The August CPI report, released September 11, is the document that made Tuesday’s hike nearly inevitable. Consumer prices rose 0.4 percent for the month, keeping the 12-month rate at 3.4 percent. Gasoline drove the headline number — up 3.9 percent in August alone and 27.4 percent versus a year earlier. The core rate told a softer story: up 0.3 percent monthly and 2.4 percent annually, the lowest annual core reading since March 2021. That divergence between headline and core is exactly the terrain that makes silver’s near-term outlook difficult to trade: the Fed cited the headline, the bond market cares about the core, and oil is the swing variable between them.
As covered in Eastern Herald’s silver price report on September 16, the Fed hiked against a backdrop where energy inflation was supplying political and data cover for a committee that had already indicated its preference for another move. The partial Saudi pipeline restoration on September 17 does not reverse the decision — the rate is 3.75 to 4.00 percent regardless — but it does reduce the forward probability of the second hike Warsh’s dot plot implies. Silver markets read that probability shift and added $0.81.
US Macro Context – September 17, 2026
| Indicator | Value / Status |
|---|---|
| Fed Funds Rate (post Sep 16) | 3.75–4.00% |
| Warsh Dot Plot Median 2026 | 4.10% |
| August NFP (Sep 5) | +162,000 (beat) |
| August CPI YoY (Sep 11) | +3.4% |
| August Core CPI YoY | +2.4% (lowest since Mar 2021) |
| August Gas Prices YoY | +27.4% |
| DXY (Sep 17) | Easing from late-July highs |
| Next Major Trigger | October 14 CPI (September data) |
| Source: BLS, Federal Reserve, CME FedWatch, September 17, 2026. | |
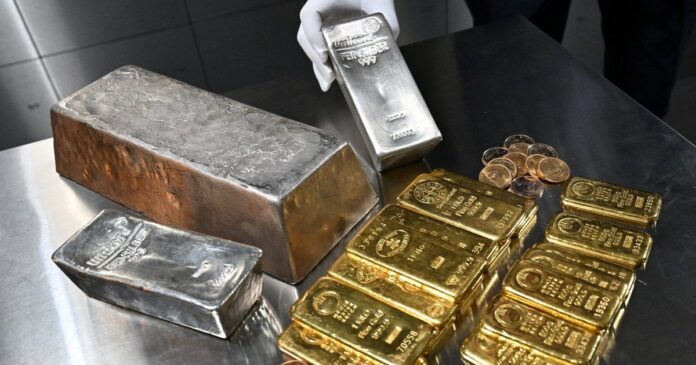
The gold-to-silver ratio on September 17 stands at approximately 68.2, materially wider than the 65.9 level recorded during September’s Iran Larak Island-driven rally. As covered in Eastern Herald’s September 17 India silver rate report, the wider ratio captures silver’s structural underperformance through the rate-hike phase: gold retains monetary and safe-haven demand that is largely rate-agnostic, while silver’s industrial demand component softens when the economic outlook dims. At a ratio of 68.2, silver is historically cheap relative to gold — which is a long-term argument for silver, but not a catalyst until the Fed cycle turns.
Silver’s year-to-date performance through the rate cycle reveals the tension in the thesis. The metal peaked at $67.92 on September 10, roughly 35 percent above its January 2026 level near $50 per ounce — a run driven by Iran safe-haven demand, the NFP miss-induced Fed cut cycle earlier in the summer, and industrial buying from the solar and electronics sectors. The Fed’s pivot from cutting to hiking has taken $3.52 off the metal in two sessions. Whether that September pullback was the correction that resets the bull case or the beginning of a deeper unwind depends on the October 14 CPI read.
Silver Market Context – September 17, 2026
| Item | Value |
|---|---|
| XAG/USD Sep 17 | $64.40/oz |
| XAU/USD Sep 17 (approx) | ~$4,390/oz |
| Gold/Silver Ratio | ~68.2 |
| Sep 8 Iran Rally High | $66.92 |
| Sep 10 Cycle High | $67.92 |
| Jan 2026 Approx Level | ~$50/oz |
| YTD Change | ~+$14.40 (+28.8%) |
| 52-Week High | ~$122 (Feb 2026) |
| Current vs 52-Week High | −$57.60 (−47.2%) |
| XAG/USD spot. 52-week high from Feb 2026 record. Source: Investing.com, September 17, 2026. | |
The outlook for the remainder of September is binary in the way that markets rarely offer cleanly. If the October 14 CPI confirms that August’s headline inflation was primarily an energy story — transient, already reversing as Saudi capacity recovers — then the case for Warsh’s second hike weakens materially, the dollar retraces, and XAG/USD has a clear path back toward $67 to $70. If the September data shows core services inflation accelerating, validating the 4.1 percent dot plot, silver faces a second leg lower toward $60 to $62 and the Iran-driven safe-haven rally of early September will be fully unwound. There is no middle scenario that is tradeable; the asymmetry is sharp.
Frequently Asked Questions – Silver Price USA, September 17, 2026
What is the silver price today, September 17, 2026?
Silver is trading at approximately $64.40 per troy ounce on September 17, 2026, up $0.81 or 1.27 percent from the September 16 close of $63.59. The session range is $63.44 to $64.93. The recovery follows partial restoration of Saudi Arabia’s East-West crude pipeline, which eased oil prices and reduced one inflation-pressure channel the Fed had relied on in its September 16 hike.
Why did the Federal Reserve raise rates on September 16, 2026?
The Federal Reserve raised the federal funds target range to 3.75–4.00 percent on September 16, citing the August CPI reading of 3.4 percent annual inflation, an NFP beat of 162,000 jobs in August, and the persistence of core services inflation. Fed Chair Kevin Warsh’s post-meeting dot plot set the median 2026 rate projection at 4.1 percent, indicating at least one additional hike remains on the committee’s radar.
What is COMEX silver trading at on September 17, 2026?
COMEX December 2026 silver futures are trading at approximately $64.65 per troy ounce on September 17, a small premium to spot that reflects the cost of carry through the December contract. Open interest remains elevated following the September 16 Fed decision.
What was in the August 2026 CPI report?
The August 2026 CPI report, released September 11, showed headline consumer prices rising 0.4 percent for the month, keeping the 12-month rate at 3.4 percent. Gasoline surged 3.9 percent in August and 27.4 percent year-over-year, accounting for over a third of the monthly increase. Core CPI rose 0.3 percent monthly and 2.4 percent annually — its lowest annual reading since March 2021. The energy-driven headline gave the Fed cover to hike; the soft core creates the uncertainty that limits further hawkishness.
What is the gold-to-silver ratio on September 17, 2026?
The gold-to-silver ratio stands at approximately 68.2 on September 17, 2026, widened from 65.9 during the Iran Larak Island-driven rally on September 8. A higher ratio indicates silver has underperformed gold through the rate-hike phase, consistent with silver’s larger industrial demand exposure acting as a headwind in a high-rate, slower-growth environment.
When is the next US CPI report?
The next US Consumer Price Index report is scheduled for release on October 14, 2026, covering September 2026 prices. This report will be the primary data input for the November FOMC meeting and is the most consequential near-term catalyst for XAG/USD’s direction.
What is the silver price outlook after the September 16 Fed hike?
The outlook is binary. A cool October CPI showing September inflation easing from August’s 3.4 percent headline — particularly if energy prices fell as Saudi capacity restored — would reduce the probability of a second hike, weaken the dollar, and support a recovery toward $67–$70. A hot reading validating Warsh’s 4.1 percent dot plot would push XAG/USD toward $60–$62, fully unwinding September’s Iran-driven rally.
[Closing Update — September 17, 2026]
This article will be updated through the New York session close. The next scheduled data event is the October 14, 2026 CPI release. Monitor XAG/USD and oil markets for intraday developments.