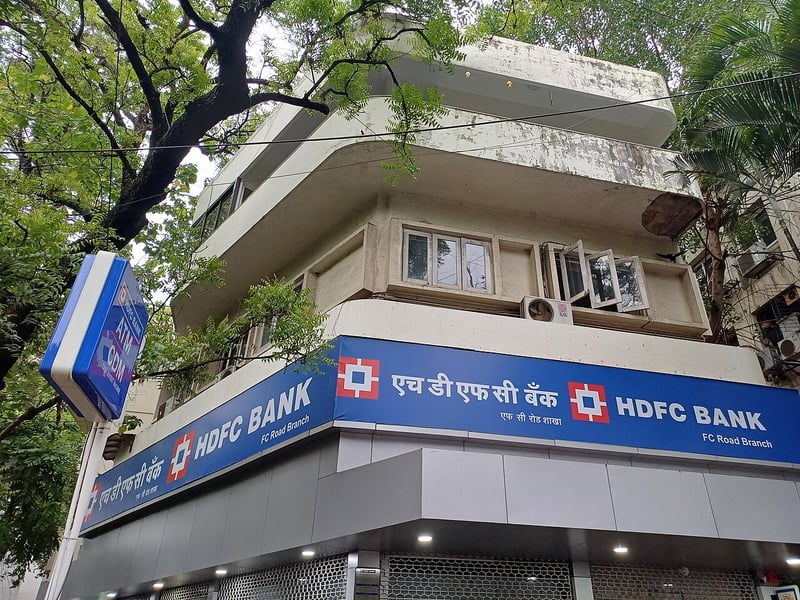

MUMBAI — HDFC Bank grew its deposits 13.3 percent in the June quarter and its loan book 15.4 percent, the sort of numbers that would have carried the stock in any year before this one. On Monday the shares closed at ₹729, which is ₹13.90 above the lowest price they have fetched in twelve months and 28.6 percent below the highest.
India’s most valuable private-sector lender ended August 24, 2026 up ₹2.05 or 0.28 percent on the National Stock Exchange, and ₹1.00 or 0.14 percent higher at ₹728.50 on the BSE. It opened at ₹732.50, ran to ₹734.40, sagged to ₹724.10 and finished at precisely the level it closed at a week earlier on August 17. Turnover was 1.14 crore shares, the thinnest in nine sessions, on a day the Nifty 50 slipped 0.14 percent to 24,219.05 and the Sensex 0.22 percent to 77,369.11.
The distance between how fast the bank is growing and how little the market will pay for that growth reduces to a single figure the growth numbers do not contain. HDFC Bank earned a net interest margin of 3.26 percent in the quarter ended June 30, the lowest it has ever reported, and the reason sits on page 14 of the bank’s own investor deck. Between March and June the yield on its assets fell from 7.8 percent to 7.7 percent. The cost of its money did not move at all.
HDFC Bank Share Price Today: NSE and BSE Close for August 24, 2026
| Measure | NSE · HDFCBANK | BSE · 500180 |
|---|---|---|
| Closing price | ₹729.00 | ₹728.50 |
| Previous close | ₹726.95 | ₹727.50 |
| Change | +₹2.05 (+0.28%) | +₹1.00 (+0.14%) |
| Open | ₹732.50 | ₹729.20 |
| Day’s high | ₹734.40 | ₹734.40 |
| Day’s low | ₹724.10 | ₹724.10 |
| Volume traded | 1.14 crore shares | – |
| 52-week high | ₹1,020.50 (-28.56% from today’s close) | |
| 52-week low | ₹715.10 (+1.94% from today’s close) | |
| Market capitalisation | ₹11,22,621 crore | |
| Trailing P/E · Price to book | 14.2 · 1.87 | |
| Book value per share · Return on equity | ₹390 · 13.6% | |
| NSE and BSE closing prices for August 24, 2026. BSE figures come from the exchange’s own quote feed, timestamped 16:00 IST. Valuation ratios and market capitalisation are Screener’s consolidated figures; the BSE’s own multiple differs because it runs off a standalone earnings-per-share number that predates last year’s bonus issue. | ||
That 52-week range is worth sitting with. The stock has fallen 28.56 percent from its high and risen 1.94 percent from its low, which is another way of saying it is trading within a rounding error of the worst price anyone has paid for it in a year. The Nifty 50, over the same window, is nowhere near its own floor. Whatever is holding HDFC Bank down is specific to HDFC Bank.
HDFC Bank Stock Code on NSE, BSE, NYSE and Global Data Feeds
| Exchange or provider | Code | Notes |
|---|---|---|
| NSE (National Stock Exchange) | HDFCBANK | Series EQ. Nifty 50 and Nifty Bank constituent |
| BSE (Bombay Stock Exchange) | 500180 | Scrip code. Group A, BSE Sensex constituent |
| ISIN | INE040A01034 | Depository identifier. Face value ₹1 |
| NYSE (American depositary shares) | HDB | Quoted at $23.24 on Monday. Three ordinary shares per ADS |
| Google Finance | NSE:HDFCBANK · BOM:500180 · NYSE:HDB | The exchange-prefixed format Google requires |
| Yahoo Finance | HDFCBANK.NS · HDFCBANK.BO · HDB | Suffix marks the exchange |
| ISIN and scrip code confirmed against the BSE’s company header feed. The ADS ratio is not stated on the quote page; at Monday’s closing prices and an implied rate near ₹94.80 to the dollar, three ordinary shares work out to $23.07 against the $23.24 the ADS fetched, which is the ratio the arithmetic supports. | ||
Why the Margin Keeps Falling: HDFC Bank Q1 FY27 in Numbers
The June-quarter results, approved by the board on July 18 and published the same weekend, were not bad. Profit after tax came in at ₹19,060 crore, up 5.0 percent year on year, and 9.8 percent once you strip out the transaction gains the bank booked a year earlier on its HDB Financial Services stake. Net interest income rose 6.7 percent to ₹33,530 crore. Bad loans barely moved: gross non-performing assets at 1.17 percent, 0.91 percent excluding agriculture, net NPAs at 0.4 percent. Capital is abundant at 19.6 percent, with core equity tier one at 17.4 percent.
| Measure | Q1 FY27 | Q4 FY26 | Q1 FY26 | Change YoY |
|---|---|---|---|---|
| Net interest income | ₹33,530 cr | ₹33,080 cr | ₹31,440 cr | +6.7% |
| Non-interest income | ₹12,820 cr | ₹13,200 cr | ₹21,730 cr | -41.0% |
| Provisions | ₹3,060 cr | ₹2,610 cr | ₹14,440 cr | -78.8% |
| Profit after tax | ₹19,060 cr | ₹19,220 cr | ₹18,160 cr | +5.0% |
| Net interest margin | 3.26% | 3.38% | – | Record low |
| Return on assets · equity | 1.85% · 13.8% | – | – | – |
| Gross NPA · net NPA | 1.17% · 0.40% | – | – | Stable |
| CASA ratio | 32% | 34% | – | -2 points |
| Earnings per share (quarter) | ₹12.40 | – | – | – |
| Standalone Indian GAAP figures from HDFC Bank’s Q1 FY2027 investor presentation, converted from billions to crore. The year-on-year falls in non-interest income and in provisions both reflect one-off items in the June 2025 quarter tied to the HDB Financial Services transaction. | ||||
None of that explains a share price 28 percent off its high. What does is the deposit mix. Average current and savings balances rose 4.2 percent over the quarter. Average time deposits rose 6.3 percent. Because the second grew faster than the first, the proportion of the bank’s funding that costs it almost nothing fell to 32 percent, from 34 percent in March and 38 percent two years ago. HDFC Bank is buying its growth with money it has to pay for.
The Spread That Stopped Widening
Set the two halves of the margin side by side over six quarters and the shape of the problem is plain.
| Quarter | Yield on assets | Cost of funds | Spread | CASA ratio |
|---|---|---|---|---|
| Q4 · March 2025 | 8.4% | 4.9% | 3.5 pts | 35% |
| Q1 · June 2025 | 8.1% | 4.8% | 3.3 pts | – |
| Q2 · September 2025 | 7.8% | 4.6% | 3.2 pts | – |
| Q3 · December 2025 | 7.8% | 4.5% | 3.3 pts | 34% |
| Q4 · March 2026 | 7.8% | 4.4% | 3.4 pts | 34% |
| Q1 · June 2026 | 7.7% | 4.4% | 3.3 pts | 32% |
| Figures as printed in HDFC Bank’s quarterly investor presentations; cost of funds includes shareholders’ funds. Spread is the difference between the two, calculated by The Eastern Herald and rounded to one decimal place, so it will not always reconcile exactly with the reported margin, which is struck on total assets. | ||||
Read across the two middle columns and the sequence is not one of collapse. Through 2025 both numbers fell together and the spread held between 3.2 and 3.4 points. What changed in the June quarter is that only one of them moved. The cost of funds stopped at 4.4 percent for a second consecutive quarter while the yield gave up another tenth of a point, and 32 percent CASA is the reason it stopped. A bank whose cheap deposits are shrinking as a share of the total has no way to follow lending rates down.
What the Market Pays for HDFC Bank’s Returns
The cleanest way to see how the market is treating the stock is to price its returns against the two banks it competes with directly.
| Bank | Close (₹) | Change | Price to book | Return on equity | Book multiple per point of ROE |
|---|---|---|---|---|---|
| HDFC Bank | 729.00 | +0.28% | 1.87 | 13.6% | 0.138 |
| ICICI Bank | 1,415.00 | -0.35% | 2.69 | 15.9% | 0.169 |
| State Bank of India | 1,039.50 | -0.88% | 1.54 | 15.4% | 0.100 |
| Closing prices for August 24, 2026. Price to book and return on equity are Screener’s. The final column is the price-to-book multiple divided by the return on equity, calculated by The Eastern Herald. It is a crude measure: it assumes returns are comparable across banks with different loan mixes and funding profiles, which they are not exactly. | |||||
On that measure investors are paying about 0.14 times book for each percentage point of return HDFC Bank generates, against 0.17 for ICICI Bank and 0.10 for the State Bank of India. The private-sector premium over the state lender survives intact. What has gone is HDFC Bank’s premium over its nearest private rival: the market now charges roughly 19 percent less for a point of HDFC Bank’s return than for a point of ICICI’s.
HDFC Bank Share Price: Recent Sessions and the Levels That Matter
| Date | Close (₹) | Change | Volume |
|---|---|---|---|
| August 17, 2026 | 729.00 | +0.28% | 1.48 crore |
| August 18, 2026 | 723.00 | -0.82% | 1.79 crore |
| August 19, 2026 | 720.00 | -0.41% | 2.13 crore |
| August 20, 2026 | 725.05 | +0.70% | 1.76 crore |
| August 21, 2026 | 726.95 | +0.26% | 2.60 crore |
| August 24, 2026 | 729.00 | +0.28% | 1.14 crore |
| NSE closing prices and volumes. Six sessions, a high of ₹729 and a low of ₹720, on turnover that fell by more than half between Friday and Monday. | |||
Six sessions have produced a nine-rupee range and no direction. The floor that matters is the 52-week low of ₹715.10, which Monday’s low of ₹724.10 did not seriously test. Above, ₹734.40 has now capped the stock twice, and there is a great deal of open ground between that and the ₹1,020.50 the shares fetched a year ago.
What this article cannot tell you is where the CASA ratio stops. The bank’s presentation sets no target for it, management has offered no floor for the margin, and the July earnings call produced no date by which the funding mix is expected to normalise. Nor is it clear where the current and savings balances that left the bank between March and June actually went, whether into HDFC Bank’s own time deposits at a higher rate, into a rival’s, or into the assets that have been drawing Indian household savings all year while gold made three-month highs. The bank does not disclose that, and until the mix turns, every rupee of loan growth HDFC Bank reports arrives a little more expensively than the last.
Elsewhere on Monday the day’s real movement was in metals and defence, where Steel Authority of India rose 3.57 percent on four times its usual volume and the large defence names split sharply, with Hindustan Aeronautics down 1.88 percent and Cochin Shipyard up 2.26 percent.
HDFC Bank’s Q1 FY2027 figures are drawn from the bank’s own quarterly investor presentation and the transcript of the July 18 earnings call. Closing prices and the scrip identifiers were verified against the BSE’s own quote feed for scrip 500180.