
MUMBAI — The State Bank of India reported the largest quarterly profit in its history this month and the lowest bad-loan ratios it has recorded in more than twenty years. Its shares have fallen in six of the seven sessions since.
SBI closed Monday, August 24, 2026, at ₹1,039.50 on the National Stock Exchange, down ₹9.20 or 0.88 percent, and at ₹1,038.00 on the BSE, off 0.71 percent. It opened at ₹1,047.90, which was also the day’s high, and worked steadily lower to ₹1,032.10 before a modest close. Volume was 88.64 lakh shares, the heaviest in eight sessions and rising as the price fell. The stock has given up 4.0 percent since August 13.
The reason a record quarter has produced a sliding share price is in the two growth rates the bank published. Gross advances rose 18.63 percent over the year. Deposits rose 9.73 percent. A bank that lends at nearly twice the rate it takes money in is a bank running down its own slack, and the ratio that measures how much slack is left has moved further in one year than it has in most of the last decade.
SBI Share Price Today: NSE and BSE Close for August 24, 2026
| Measure | NSE · SBIN | BSE · 500112 |
|---|---|---|
| Closing price | ₹1,039.50 | ₹1,038.00 |
| Previous close | ₹1,048.70 | ₹1,045.40 |
| Change | -₹9.20 (-0.88%) | -₹7.40 (-0.71%) |
| Open | ₹1,047.90 | ₹1,048.95 |
| Day’s high | ₹1,047.90 | ₹1,048.95 |
| Day’s low | ₹1,032.10 | ₹1,032.05 |
| Volume traded | 88.64 lakh shares | – |
| 52-week high | ₹1,234.70 (-15.81% from today’s close) | |
| 52-week low | ₹798.50 (+30.18% from today’s close) | |
| Market capitalisation | ₹9,62,552 crore | |
| Trailing P/E · Price to book | 11.5 · 1.54 | |
| Book value per share · Return on equity | ₹674 · 15.4% | |
| NSE closing prices for August 24, 2026, with BSE figures from the exchange’s own quote feed, timestamped 16:00 IST. The day’s high on both exchanges was the opening price, which is why the session reads as one continuous slide. Valuation ratios and market capitalisation are Screener’s; the bank’s own reported return on equity for the June quarter, annualised, was 17.87 percent. | ||
At 11.5 times earnings and 1.54 times book, SBI is the cheapest of India’s three largest banks on both measures, and it earns the highest return on equity of the three. That combination is either a market inefficiency or a judgment about state ownership, and it has persisted long enough that the second explanation deserves the benefit of the doubt.
State Bank of India Stock Code on NSE, BSE and Global Data Feeds
| Exchange or provider | Code | Notes |
|---|---|---|
| NSE (National Stock Exchange) | SBIN | Series EQ. Nifty 50 and Nifty Bank constituent |
| BSE (Bombay Stock Exchange) | 500112 | Scrip code. Group A, BSE Sensex constituent |
| ISIN | INE062A01020 | Depository identifier. Face value ₹1 |
| Google Finance | NSE:SBIN · BOM:500112 | The exchange-prefixed format Google requires |
| Yahoo Finance | SBIN.NS · SBIN.BO | Suffix marks the exchange |
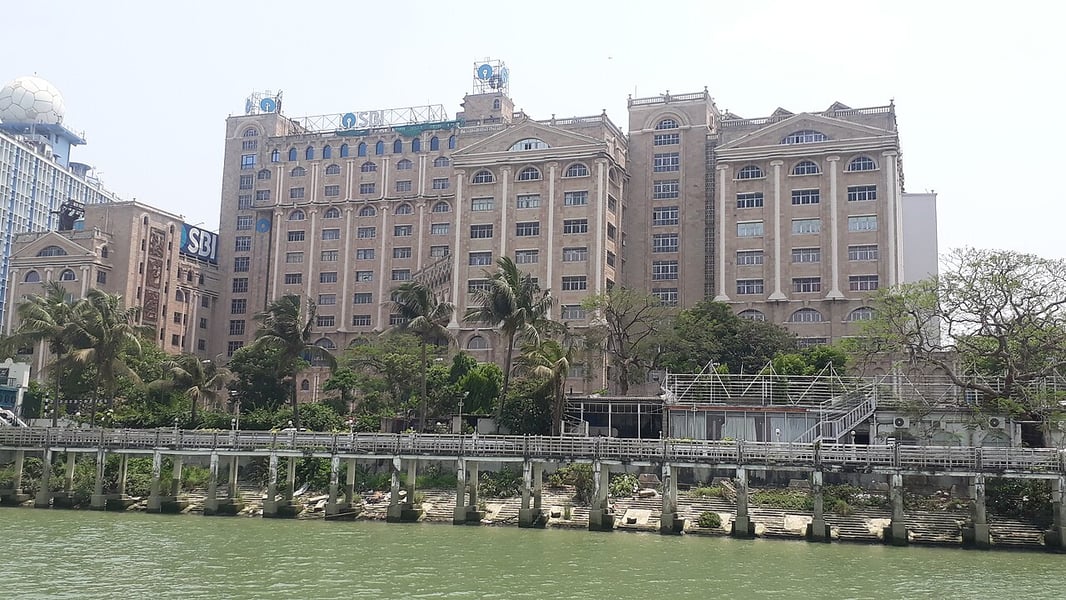
| ISIN, scrip code and face value confirmed against the BSE’s company header feed. SBI is a statutory body constituted under the State Bank of India Act, 1955, headquartered at Nariman Point, Mumbai, with the Government of India as its majority shareholder. | ||
SBI Q1 FY27: A Record Quarter, Reported in Full
The results, published on August 7, 2026, are strong on every line the bank chose to highlight.
| Measure | Q1 FY27 | Q1 FY26 | Change |
|---|---|---|---|
| Net interest income | ₹46,992 cr | ₹40,907 cr | +14.88% |
| Operating profit | ₹33,529 cr | ₹30,544 cr | +9.77% |
| Net profit | ₹21,121 cr | ₹19,160 cr | +10.23% |
| Net interest margin, whole bank | 2.86% | 2.89% | -3 bps |
| Net interest margin, domestic | 3.00% | 3.01% | -1 bp |
| Gross advances | ₹50,47,222 cr | ₹42,54,516 cr | +18.63% |
| Total deposits | ₹60,05,805 cr | ₹54,73,254 cr | +9.73% |
| Gross NPA · net NPA | 1.47% · 0.38% | 1.83% · 0.47% | -36 bps · -9 bps |
| Credit cost | 0.27% | 0.47% | -20 bps |
| Return on assets · return on equity | 1.11% · 17.87% | – | – |
| Capital adequacy | 15.67% | 14.63% | +104 bps |
| Provision coverage ratio | 74.20% | 74.49% | -29 bps |
| Figures as printed in SBI’s Q1 FY2027 analyst presentation of August 7, 2026. The bank describes the 1.47 percent gross NPA and 0.38 percent net NPA ratios as its lowest in more than two decades. Domestic net interest margin improved 7 basis points against the March quarter even as it slipped 1 basis point against a year earlier. | |||
Nothing in that table is bad. Two things in it are worth reading against each other. The margin, at 2.86 percent whole-bank, is the thinnest of the three large lenders by a distance, roughly 150 basis points below ICICI Bank’s. And the credit cost of 0.27 percent, down 20 basis points, is doing real work in the profit line: cheap provisions are a tailwind that flattens out once bad loans stop falling, and at 1.47 percent gross they do not have much further to fall.
The Ratio SBI Did Not Put on a Slide
Divide gross advances by total deposits and you get the credit-deposit ratio, the single number that says how much room a bank has left to keep lending out of what it already holds.
| Measure | June 2026 | June 2025 | Change |
|---|---|---|---|
| Gross advances | ₹50,47,222 cr | ₹42,54,516 cr | +18.63% |
| Total deposits | ₹60,05,805 cr | ₹54,73,254 cr | +9.73% |
| Credit-deposit ratio | 84.04% | 77.73% | +6.31 points |
| Current account deposits | ₹3,34,649 cr | ₹3,21,714 cr | +4.02% |
| Savings bank deposits | ₹19,26,277 cr | ₹17,46,813 cr | +10.27% |
| Term deposits | ₹35,00,427 cr | ₹31,86,346 cr | +9.86% |
| Domestic CASA ratio | 39.24% | – | – |
| Advances, deposits and the deposit mix are as printed in SBI’s Q1 FY2027 analyst presentation. The credit-deposit ratio is calculated by The Eastern Herald as gross advances divided by total deposits, on a whole-bank basis including foreign offices. Banks calculate this ratio on several different bases and SBI does not publish this particular one. | |||
Six and a third percentage points in twelve months is a large move for a balance sheet of this size. It is also, in a sense, good news: SBI has spent years with more deposits than it could profitably lend, and putting them to work is what a bank is for. But the arithmetic only runs one way for so long. Either deposit growth accelerates, which means paying more for money and pushing a 2.86 percent margin thinner still, or loan growth slows from 18.63 percent, which removes the reason the stock rose 30 percent off its low in the first place.
The deposit mix says which pressure is arriving first. Current accounts, the cheapest money any bank has, grew 4.02 percent. Savings deposits grew 10.27 percent and term deposits 9.86 percent. That is the same shape visible at HDFC Bank, where the CASA ratio has fallen to 32 percent, and it is the defining feature of Indian banking this year.
What the Market Pays for Each Bank’s Returns
| Bank | Close (₹) | Change | Price to book | Return on equity | Book multiple per point of ROE |
|---|---|---|---|---|---|
| State Bank of India | 1,039.50 | -0.88% | 1.54 | 15.4% | 0.100 |
| HDFC Bank | 729.00 | +0.28% | 1.87 | 13.6% | 0.138 |
| ICICI Bank | 1,415.00 | -0.35% | 2.69 | 15.9% | 0.169 |
| Closing prices for August 24, 2026. Price to book and trailing return on equity are Screener’s, which is why SBI’s 15.4 percent here differs from the 17.87 percent the bank reported for the June quarter alone. The final column is price to book divided by return on equity, calculated by The Eastern Herald. It is a crude measure and assumes returns are comparable across banks with very different loan mixes, which they are not exactly. | |||||
On that measure an investor pays 0.10 times book for each percentage point of SBI’s return, against 0.14 for HDFC Bank and 0.17 for ICICI. SBI is 41 percent cheaper than ICICI per unit of return. The discount is not new and it is not obviously irrational: the government’s majority holding brings priority-sector obligations, occasional policy lending and a thinner margin as a structural feature rather than a passing one.
SBI Share Price: Recent Sessions and the Slide
| Date | Close (₹) | Change | Volume |
|---|---|---|---|
| August 13, 2026 | 1,083.00 | – | 95.02 lakh |
| August 14, 2026 | 1,067.70 | -1.41% | 62.74 lakh |
| August 17, 2026 | 1,061.20 | -0.61% | 70.39 lakh |
| August 18, 2026 | 1,053.00 | -0.77% | 55.84 lakh |
| August 19, 2026 | 1,048.60 | -0.42% | 71.83 lakh |
| August 20, 2026 | 1,048.00 | -0.06% | 58.80 lakh |
| August 21, 2026 | 1,048.70 | +0.07% | 65.34 lakh |
| August 24, 2026 | 1,039.50 | -0.88% | 88.64 lakh |
| NSE closing prices and volumes. Seven declines in eight sessions, a cumulative 4.0 percent, with Monday’s turnover the heaviest since August 13. | |||
Eight sessions, seven of them down, and the heaviest volume of the run arriving on the largest fall. ₹1,032.10 was Monday’s low and there is no obvious support between there and the round ₹1,000. The 52-week low of ₹798.50 is 30 percent below the current price, so the stock is still much closer to the top of its range than the bottom.
What this article cannot tell you is what is doing the selling. SBI made no announcement on Monday and there was no news out of the bank. A 4 percent slide on rising volume in the three weeks after record results, with the sector’s two private-sector giants going sideways over the same period, is the sort of pattern that usually has an institutional explanation, and none is publicly available. The bank publishes its credit-deposit ratio in several forms but not the whole-bank number calculated here, and it has given no guidance on where deposit growth needs to reach to fund an 18.63 percent loan book. Until it does, the tension in the results stays exactly where it is.
Elsewhere on Monday, ICICI Bank closed at ₹1,415 within 4.4 percent of its 52-week high, Reliance Industries eased 0.47 percent to ₹1,309.80 and Steel Authority of India rose 3.57 percent on four times normal volume.
SBI’s June-quarter figures are drawn from the bank’s own Q1 FY2027 analyst presentation of August 7, 2026. Closing prices and the scrip identifiers were verified against the BSE’s own quote feed for scrip 500112.