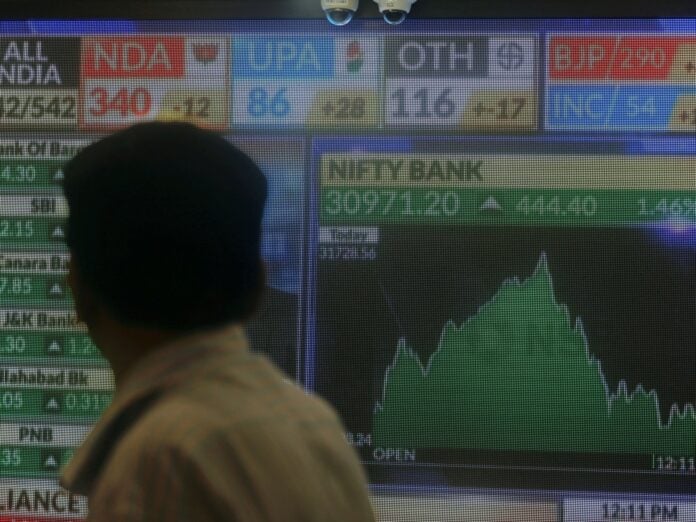

MUMBAI — Retail investors who had been warned for two years about midcap and smallcap valuations found themselves on the right side of a record by August 2026. The Nifty Midcap 100 closed at an all-time high of 64,162.9 on August 25. Five days earlier, the Nifty Smallcap 100 reached 19,978. The benchmark Nifty 50, heavy with the banks, IT exporters, and energy conglomerates that dominate the large-cap earnings pool, remained 7.6 percent below its own all-time high, still processing a profit cycle running at a fraction of the broader market’s pace.
The gap between those endpoints traces directly to Q1 FY27 earnings. India’s smallcap companies delivered profit growth of 30 percent in the three months ended June 30, 2026. Midcaps grew earnings at 16 percent. Large-caps, encompassing most of the Nifty 50 and the major bank stocks, came in at 8 percent. That differential, sustained across a full quarter rather than a single earnings beat, is the cleanest explanation for what happened to Indian equity indices through August.
| Segment | Q1 FY27 Profit Growth | FY27 Full-Year Estimate | |||||||
|---|---|---|---|---|---|---|---|---|---|
| Nifty 50 (Large-cap) | ~8% | ~12% | |||||||
| Nifty Midcap 100 | 16% | ~16% | |||||||
| Nifty Smallcap 100 | 30% | ~25% | |||||||
| NIFTY 500 (Q4 FY26 base) | 14.3% YoY | — | |||||||
| Source: BSE/NSE filings, company Q1 FY27 earnings reports. | |||||||||
The earnings story had a structural foundation that preceded it. AMFI data shows SIP inflows held above Rs 26,000 crore per month through Q1 FY27, with midcap and smallcap funds capturing a disproportionate share of the systematic flows. SIPs now account for 53 percent of smallcap fund AUM and 46% of midcap AUM — a participation share that has grown from roughly 40 percent in 2019. The consequence of that shift: a wave of retail capital enters the broader market each month regardless of index levels, creating a demand floor that broader market stocks did not have in prior cycles.
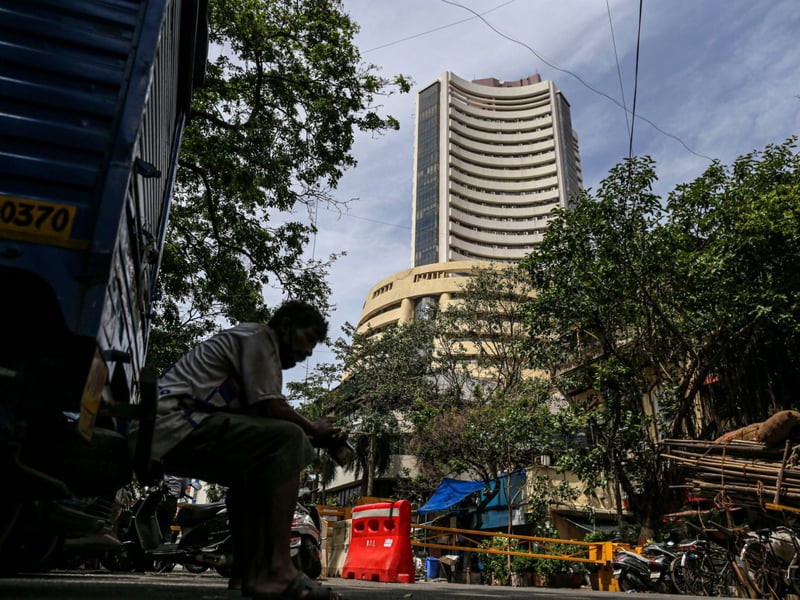
That floor proved its durability during the 2025 correction. When the Nifty corrected approximately 10 percent between September and November 2025, midcap and smallcap fund inflows barely moderated, according to Business Standard. The contrast with 2018 — when sustained outflows followed a 30 percent small-cap correction — reflects how thoroughly the SIP distribution model has displaced lump-sum investing as the default equity participation mode for Indian households.
Foreign portfolio investors added a second catalyst in August 2026. After net sales through much of 2025, FPIs purchased approximately Rs 23,544 crore in Indian equities during August, with improving earnings quality and a stabilising rupee widening the gap between Indian equity yields and US Treasuries. Part of that capital targeted the broader market, adding a valuation catalyst on top of the earnings re-rating already underway.
At the sector level, Q1 FY27 midcap and smallcap earnings had identifiable sources. Capital goods companies, benefiting from infrastructure order flows under India’s Rs 26.75 trillion FY27 capex cycle documented in India’s FY27 investment analysis, posted revenue growth above 20 percent across several index constituents. Consumer discretionary stocks in the midcap segment — electrical equipment, home appliances, and premium apparel — captured urban consumption that bypassed the FMCG staples segment, where HUL and Nestle reported mid-single-digit volume growth. Healthcare API manufacturers and CDMO contractors contributed disproportionately to the smallcap earnings pool, as documented in India’s Q1 FY27 pharma analysis. Across the NIFTY 500, Q4 FY26 had already shown midcaps outpacing their large and small-cap peers, per HDFC Mutual Fund’s quarterly analysis.
| Index | Aug 2026 Level / High | vs All-Time High | 1-Year Gain | ||||||
|---|---|---|---|---|---|---|---|---|---|
| Nifty 50 | ~25,200 | -7.6% below ATH | +2.5% | ||||||
| Nifty Midcap 100 | 64,162.9 (record) | New all-time high | +11% | ||||||
| Nifty Smallcap 100 | 19,978 (record) | New all-time high | +11% | ||||||
| Nifty Smallcap 250 PE | 31.24x | 4.3% above 7-yr median | — | ||||||
| Source: BSE/NSE filings, company Q1 FY27 earnings reports. | |||||||||
The valuation argument against midcaps and smallcaps has not been resolved — it has been complicated. The Nifty Smallcap 250’s price-to-earnings ratio stands at 31.24, approximately 4.3 percent above its seven-year median of 29.96. On price-to-earnings-growth, however, smallcaps look cheaper than both mid and large-cap counterparts — the denominator, earnings growth, has run ahead of the price multiple. Kotak AMC’s Nilesh Shah had argued at the start of 2026 that midcaps offered the better risk-adjusted position for FY27: earnings delivery more visible than in smallcaps, growth rate meaningfully higher than large-caps could offer.
That call has cleared its first checkpoint. Whether it clears the second depends on Q2 FY27. The risk is specific: the 30 percent smallcap growth in Q1 FY27 reflects, in part, a low base. Several sectors absorbed inventory corrections and margin pressure in Q1 FY26, creating the denominator that makes Q1 FY27 look exceptional. If actual Q2 FY27 smallcap earnings come in at 12 to 15 percent rather than the 25 to 30 percent currently estimated, valuations will compress even as profits grow. That gap between estimate and delivery is where India’s broader equity story will be written in the next two quarters.
What Q1 FY27 established, and what the August records confirmed, is that India’s equity market is not operating as one market. Large-caps offer stability and institutional liquidity; they are not offering growth leadership this cycle. The full picture of where that corporate profit growth is coming from is documented in India’s Q1 FY27 earnings review. Midcaps and smallcaps are offering growth leadership at a valuation premium that is real but not yet extreme. The capital — domestic SIP flows, returning FPI money, and the earnings momentum itself — is doing what capital does: it is following the growth.