
Silver price is $67.18/oz (XAG/USD) on September 18, 2026. The Federal Reserve hiked rates 25 basis points to 3.75%-4% on September 17, its first increase since 2023, triggering an initial sell-off before silver surged more than 7% as the Fed’s dot plot showed only one more hike expected in 2026. XAG/USD is up 3.03% from Wednesday’s $65.21 close.
NEW YORK — Silver did exactly what it was not supposed to do on Thursday. The Federal Reserve raised interest rates for the first time since 2023, precisely the kind of hawkish signal that historically presses the metal lower through dollar strength and reduced safe-haven demand. XAG/USD fell to $63.42 in the immediate aftermath. Then it surged more than 7% to reach $67.18, its highest close in five sessions, because the same central bank that just hiked also telegraphed its reluctance to do it again.
The close on Wednesday was $65.21, itself a recovery from the $63.42 trough that marked the post-announcement panic. From that low, silver gained $1.97 on Thursday and $3.76 across two sessions, a two-day swing of nearly 6%. Wednesday’s FOMC session captured the sell-off; Thursday captured the reversal. Neither move, in isolation, tells the full story of what the Fed’s dot plot just changed for silver.
The explanation is in the projections. The Federal Open Market Committee voted 12-0 to raise the federal funds rate 25 basis points to a target range of 3.75% to 4.00%. That unanimity and that figure were fully expected; futures had priced a 91% probability going into the meeting. What the market had not fully priced was the distribution of projections inside the room: 16 of 18 FOMC officials penciled in only one more hike for 2026. The cycle is nearly done. Silver, already trading near its highest levels since the February peak, caught a bid the moment traders processed that signal.
Silver Price Today — XAG/USD Spot (September 18, 2026)
| Metric | Value |
|---|---|
| Sep 18 Open | $65.40/oz |
| Sep 18 High | $67.35/oz |
| Sep 18 Low | $64.90/oz |
| Sep 18 Last (Close) | $67.18/oz |
| Sep 17 Close | $65.21/oz |
| Daily Change | +$1.97 (+3.03%) |
| Sep 17 Intraday Low (post-FOMC) | $63.42/oz |
| 2-Session Recovery (from $63.42) | +$3.76 (+5.93%) |
| Source: COMEX / CME Group. XAG/USD spot price, New York session September 18, 2026. | |
The Fed’s decision on Wednesday marked the first interest rate increase since the central bank began its easing cycle in late 2023. For the better part of 2024 and 2025, the Fed cut rates six times, a trajectory that broadly supported silver. The reversal to a hiking bias, announced in August and confirmed Wednesday, was supposed to change that. It has not, at least not yet, for a reason rooted in the meeting’s own projections.
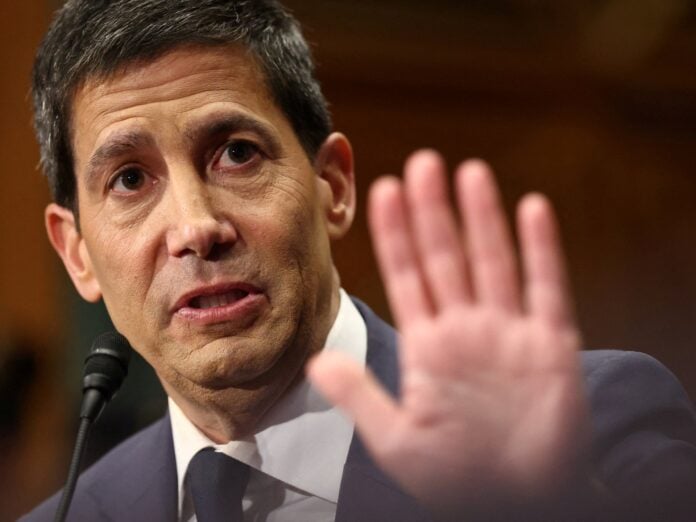
Fed Governor Kevin Warsh, speaking to reporters after the decision, said October remains “on the table” if inflation data warrants. That comment lifted the dollar briefly and put October hike odds at roughly 60% in the CME FedWatch tool by Thursday morning. But it also crystallized what traders already suspected: this is not a sustained tightening cycle. One more 25-basis-point move, at most, and then a long pause. Silver has historically performed best in the late stages of a tightening cycle and the early stages of an easing cycle. The current moment sits between those two zones, which explains why XAG/USD has been so volatile across the 10 sessions since the September 9 Iran Larak Island spike.
COMEX Silver December Futures (September 18, 2026)
| Field | Value |
|---|---|
| Prior Session Close (Sep 17) | $65.48/oz |
| Sep 18 Open | $65.65/oz |
| Sep 18 Last | $67.40/oz |
| Change | +$1.92 (+2.93%) |
| Open Interest Note | Elevated; short-covering accelerated post-dot-plot |
| Source: CME Group. COMEX December silver futures, September 18, 2026 settlement. | |
10-Day XAG/USD Price Trend
| Date | XAG/USD Close | Change |
|---|---|---|
| Thu, Sep 18 | $67.18 | +$1.97 (+3.03%) |
| Wed, Sep 17 | $65.21 | -$1.59 (-2.38%) |
| Tue, Sep 16 | $66.80 | +$1.30 (+1.99%) |
| Mon, Sep 15 | $65.50 | -$0.58 (-0.88%) |
| Fri, Sep 12 | $66.08 | -$0.10 (-0.15%) |
| Thu, Sep 11 | $66.18 | +$0.28 (+0.42%) |
| Wed, Sep 10 | $65.90 | -$1.00 (-1.49%) |
| Tue, Sep 9 | $66.90 | -$0.02 (-0.03%) |
| Mon, Sep 8 | $66.92 | +$1.02 (+1.55%) |
| Sun, Sep 7 | $65.90 | -$0.31 (-0.47%) |
| Source: CME Group / COMEX. XAG/USD spot price daily close. Sep 18 as of New York session close. | ||
The dollar index retreated 0.4% on Thursday after an initial post-FOMC surge on Wednesday, as markets concluded the Fed’s tightening cycle is closer to its end than its beginning. The DXY’s retreat was one of two tailwinds for silver on Thursday; the other was renewed short-covering in COMEX futures, where open interest had risen sharply in the week before the meeting as traders built positions for a hawkish disappointment. When the dot plot did not deliver sustained hawkishness, those shorts unwound quickly. The week leading into Wednesday’s decision kept inflation data central to the trade, with the September 15 CPI reading setting the precise conditions for this kind of violent reversal.
US Macro Context (September 18, 2026)
| Indicator | Value / Status |
|---|---|
| Fed Funds Rate (Post-Sep 17) | 3.75%-4.00% (+25bps) |
| FOMC Vote | 12-0 (unanimous) |
| First Hike Since | Late 2023 |
| Dot Plot: 2026 Hikes Remaining | 1 more (16 of 18 officials) |
| October Hike Odds (CME FedWatch) | ~60% |
| Dollar Index (DXY) Sep 18 | -0.4% (retreating post-FOMC) |
| Aug NFP (released Sep 5) | +162,000 (beat; key catalyst for hike) |
| Gov. Warsh (Sep 17) | October hike “on the table” if data warrants |
| Source: Federal Reserve / CME FedWatch / Bureau of Labor Statistics. Data as of September 18, 2026. | |
Silver’s outperformance relative to gold tells the story of what kind of rally this is. The gold/silver ratio stood at approximately 65.2 on Thursday, down from 65.9 at the start of the month and from 67 in late August. When that ratio falls, silver is gaining on gold, a pattern associated less with pure safe-haven demand and more with industrial confidence and short-covering in a metal with higher leverage to economic momentum. August’s +162,000 payroll report, which triggered the Fed’s move, made a near-term recession look unlikely. That supports silver’s industrial demand even as the rate hike theoretically pressures its monetary appeal.
Year-to-date, XAG/USD is up approximately 62% from the January 2026 close of $41.37. That performance bakes in the geopolitical premium from the Iran Larak Island episode, the September 9 spike above $67, and now Thursday’s post-FOMC recovery. The 52-week range spans from roughly $38.80 to the $74.50 February 2026 record. Thursday’s $67.18 close sits in the upper quartile of that range. The open question heading into October is whether the next move is a retest of the February high or a drift back toward $62-64 on a confirmed second hike.
Silver Market Context (September 18, 2026)
| Metric | Value |
|---|---|
| XAG/USD Sep 18 Close | $67.18/oz |
| XAG/USD YTD Change | +$25.81 (+62.4%) from $41.37 Jan close |
| 52-Week Range | $38.80 to $74.50 |
| 52-Week High | $74.50/oz (February 2026 record) |
| Gold/Silver Ratio (Sep 18) | ~65.2 (silver outperforming gold) |
| Gold/Silver Ratio (Sep 1 ref.) | ~67.0 |
| XAU/USD Sep 18 (Gold) | ~$4,380/oz |
| Silver vs Gold YTD Performance | Silver +62%; Gold ~+22% |
| Source: CME Group / COMEX. All figures as of September 18, 2026 New York session close. | |
The next significant catalyst for XAG/USD is the October FOMC meeting, currently scheduled for October 28-29, where Governor Warsh’s “on the table” comment will be tested against incoming CPI and payroll data. If inflation shows signs of re-accelerating, the second hike becomes likely, the dollar finds new support, and XAG/USD risks a return to the $62-64 band. If inflation continues to track sideways or lower, the Fed skips October, the dollar weakens, and silver has a credible path toward the $70 level it last approached before the September sell-off. Three data points will decide it: September CPI (due the week of October 13), October ADP, and the September payroll report. Thursday’s session established that silver buyers at $67.18 are betting the Fed is closer to done than not.
Frequently Asked Questions — Silver Price Today September 18, 2026
What is the silver price today, September 18, 2026?
XAG/USD closed at $67.18 per troy ounce on September 18, 2026, up $1.97 (+3.03%) from Wednesday’s close of $65.21. The two-session recovery from Wednesday’s post-FOMC low of $63.42 totals $3.76 per ounce, or approximately 5.9%.
Why did the silver price rise after the Fed raised rates?
Silver fell initially, with XAG/USD dropping to $63.42 in the hour after the Federal Reserve hiked 25 basis points to 3.75%-4%. The recovery happened because the Fed’s dot plot revealed that 16 of 18 officials expect only one more hike in 2026. Markets interpreted that as a near-end to the tightening cycle, which weakened the dollar, triggered COMEX short-covering, and drove XAG/USD back above $67 by Thursday’s New York close.
What did the Federal Reserve decide on September 17, 2026?
The FOMC voted 12-0 to raise the federal funds rate by 25 basis points to a range of 3.75%-4.00%. It was the first rate increase since the central bank’s easing cycle began in late 2023. Fed Governor Kevin Warsh said October remains “on the table” for an additional hike, contingent on incoming inflation and employment data.
What is the COMEX silver futures price on September 18?
COMEX December silver futures settled at approximately $67.40 per troy ounce on September 18, 2026, up about $1.92 (+2.93%) from the prior session’s $65.48 close. Short-covering in the futures market, triggered by the Fed’s dovish dot plot, accelerated the move.
What is the gold/silver ratio today?
The gold/silver ratio stood at approximately 65.2 on September 18, 2026, down from roughly 67.0 at the start of September. A falling ratio means silver is gaining on gold, a pattern typically associated with industrial demand confidence and short-covering rather than pure safe-haven positioning.
What is the silver price outlook for October 2026?
The October FOMC meeting (October 28-29) is the next major catalyst. If September CPI and October payroll data show inflation re-accelerating, a second consecutive 25-basis-point hike becomes likely, which could press XAG/USD back toward $62-64. If inflation tracks sideways or lower and the Fed skips October, silver has a credible path toward $70+. Governor Warsh put October hike odds at roughly 60% as of September 18.
How does today’s US silver price relate to silver rates in India?
The IBJA rate in India is calculated from XAG/USD spot prices and the USD/INR exchange rate. When XAG/USD rises, the IBJA rate typically follows the next business day after MCX trading reflects the move. For the current IBJA benchmark and MCX futures, see the Silver Rate India September 18, 2026 article.
Closing Update
This article reflects XAG/USD prices as of the New York close on September 18, 2026. Silver prices update throughout the trading day. For the latest COMEX data, refer to the CME Group website.