NEW YORK — Silver has not broken. Not yet. But two sessions of Federal Reserve officials saying the quiet part loudly – that the rate hike cycle that produced September’s increase may not stop there – have kept the metal pinned below $65 in a way the September 16 hike itself never quite managed.
XAG/USD traded at $64.23 per troy ounce in Wednesday’s North American session, a decline of $0.21 or 0.33 percent from Tuesday’s close of $64.44. The intraday range of $63.74 to $64.55 was narrow by the standards of the past two weeks, which saw a 3.12 percent single-session drop on Tuesday after Fed Chair Kevin Warsh’s remarks at the Peterson Institute for International Economics, followed by further selling Wednesday as the dollar index reached a three-week high.
The decisive event of this week was not the Federal Reserve’s September 15 to 16 meeting itself, which delivered a 25-basis-point hike the futures market had already priced at roughly 60 percent probability going in. It was the back-to-back signals from Warsh and St. Louis Fed President Alberto Musalem that a November repeat was, to use Musalem’s phrasing, “not off the table.” For silver, which had stabilized in the $65 to $67 range in the days after the hike, that combination produced a two-day drawdown that erased nearly three weeks of post-hike recovery.
Silver Price Today – September 24, 2026 (XAG/USD Spot)
| Metric | Value |
|---|---|
| Sep 24 Open | $64.44/oz |
| Sep 24 High | $64.55/oz |
| Sep 24 Low | $63.74/oz |
| Sep 24 Last | $64.23/oz |
| Sep 23 Close | $64.44/oz |
| Change | −$0.21 |
| Change % | −0.33% |
| YTD Change | +$23.23 (+56.6%) |
| Source: CME Group / COMEX spot data, North American session September 24, 2026. Prices indicative. | |
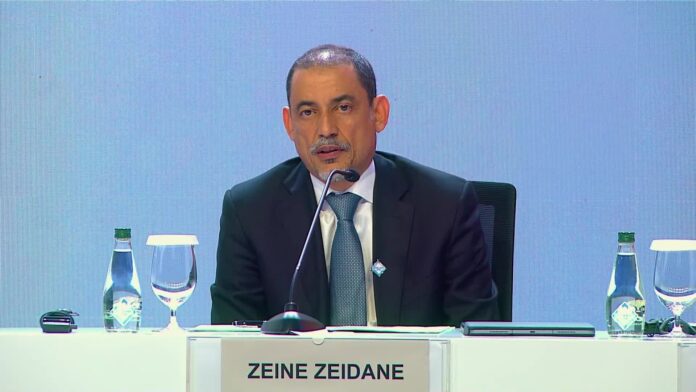
Warsh, speaking Tuesday at the Peterson Institute, said inflation remained “stickier than the forecasting consensus had assumed” and that the Federal Reserve’s dual mandate required maintaining “the credibility that comes from doing what we say.” That framing links future action to institutional credibility rather than economic data alone – the language of a central banker who wants the market to remain uncertain about November. The dollar firmed through the New York session and carried its gains into the Asia-Pacific overnight open, pulling silver down from $66.51 as recently as September 22.
Musalem’s separate remarks compounded the signal. The St. Louis Fed president, a non-voter in the 2026 FOMC cycle, has historically functioned as an indicator of the committee’s hawkish flank. His November framing arrived before Warsh’s Peterson Institute appearance but set the context for how markets read the chair’s subsequent language. Together, the two sets of remarks repriced the probability of a consecutive hike in a way that would have been difficult to anticipate from the September 7 session, when XAG/USD held above $65.90, and the Fed-hike narrative had not yet hardened into a two-official consensus.
COMEX Silver December Futures – September 24, 2026
| Field | Value |
|---|---|
| Prior Close | $64.65/oz |
| Sep 24 Open | $64.52/oz |
| Sep 24 Last | $64.50/oz |
| Change | −$0.15 |
| Change % | −0.23% |
| Contract | December 2026 |
| Source: CME Group COMEX silver futures. December contract settles monthly. Spot and futures prices diverge due to cost of carry; physical delivery involves additional charges. | |
10-Day XAG/USD Trend – September 14 to 24, 2026
| Date | XAG/USD | Change ($/oz) | Change (%) |
|---|---|---|---|
| Wed, Sep 24 | $64.23 | −$0.21 | −0.33% |
| Tue, Sep 23 | $64.44 | −$2.07 | −3.12% |
| Mon, Sep 22 | $66.51 | −$0.29 | −0.43% |
| Sun, Sep 21 | $66.80 | +$0.90 | +1.36% |
| Fri, Sep 19 | $65.90 | −$0.35 | −0.53% |
| Thu, Sep 18 | $66.25 | +$1.15 | +1.77% |
| Wed, Sep 17 | $65.10 | −$0.80 | −1.21% |
| Tue, Sep 16 | $65.90 | +$0.20 | +0.30% |
| Mon, Sep 15 | $65.70 | −$0.50 | −0.75% |
| Sun, Sep 14 | $66.20 | +$0.65 | +0.99% |
| Source: CME Group COMEX. Weekend rates reflect Globex electronic trading sessions. Values are close/settlement prices unless noted. | |||
The dollar index’s move to a three-week high is the mechanical explanation for what silver is doing this week. A stronger dollar raises the effective cost of dollar-denominated metals for international buyers, suppressing demand and applying downward pressure on spot prices. That channel was visible in both Tuesday’s 3.12 percent drop and Wednesday’s continuation – a grinding re-rating rather than a panic, but consequential for traders who had positioned for a stabilization above $66 after the Fed’s September hike.
India’s silver market reflected the same pressure through its own FX lens. The IBJA benchmark fell to ₹233.05 per gram on September 24 as the rupee softened alongside broader emerging-market currencies reacting to the dollar’s rise. Detailed rates and market context appear in the concurrent India silver rate report for September 24, 2026.
US Macro Context – September 24, 2026
| Indicator | Value / Status |
|---|---|
| August NFP (Sep 5 release) | +162,000 (beat; ~57k forecast) |
| Sep 15–16 FOMC Decision | +25 bps rate hike (as expected) |
| Warsh remarks (Sep 23) | Inflation “stickier than consensus”; credibility-linked guidance |
| Musalem (St. Louis Fed) | November FOMC “not off the table” |
| Dollar Index (DXY) | 3-week high (Sep 24) |
| USD/INR | ~₹96.50 |
| October Jobs Report | Due November 1, 2026 |
| Next FOMC Meeting | November 4–5, 2026 |
| Sources: Bureau of Labor Statistics, Federal Reserve Board, CME FedWatch, Federal Reserve Bank of St. Louis. | |
The gold-silver ratio moved to approximately 66:1 as of September 24, widening from post-hike lows near 65:1 in mid-September. That widening indicates silver is underperforming gold – a pattern consistent with silver’s dual character as a monetary metal and an industrial commodity. Dollar strength simultaneously reduces the monetary appeal of silver and signals tightening financial conditions that historically weigh on industrial metals demand. Both effects point the same direction.
Despite this week’s pressure, silver retains a position roughly 56 percent above its January 2026 opening level. The metal peaked near $75.40 in late July 2026 before the current correction sequence began. From that peak to Wednesday’s $64.23 represents a 14.7 percent pullback – significant but not structurally disqualifying within a longer uptrend. The September 4 session, when silver recovered from $63.87 on weak jobs data, established the low $64 area as a level with prior market memory attached to it.
Silver Market Context – September 24, 2026
| Metric | Value |
|---|---|
| XAG/USD Sep 24 | $64.23/oz |
| XAG/USD Jan 1, 2026 | ~$41.00/oz |
| YTD Performance | +$23.23 (+56.6%) |
| 52-Week High | ~$75.40/oz (Jul 2026) |
| 52-Week Low | ~$36.50/oz (Oct 2025) |
| Gold/Silver Ratio | ~66:1 |
| XAU/USD (Gold) | ~$4,235/oz |
| Silver vs Gold YTD | Silver +56.6% vs Gold +~40% |
| Sources: CME Group COMEX, LBMA reference data, Federal Reserve H.10 exchange rates. YTD figures are indicative through September 24, 2026. | |
What happens next depends on two data points the Federal Reserve does not yet have. The October jobs report, due November 1, and the October CPI release expected around November 12 – which falls after the FOMC but will shape December expectations. A jobs number above 150,000 with core CPI holding above 3 percent gives the Fed grounds to move again in November, and silver would face a test of $62 to $63. Softer data consistent with a labor market beginning to respond to 450-plus basis points of cumulative tightening would allow a pause and likely a recovery toward $67 to $68. The market will spend October trying to determine which scenario the data delivers. Silver will move with every incremental update.
Frequently Asked Questions
What is the silver price today, September 24, 2026?
Silver (XAG/USD) is trading at approximately $64.23 per troy ounce on September 24, 2026, a decline of $0.21 or 0.33 percent from Tuesday’s close of $64.44. The session range has been $63.74 to $64.55.
Why did silver fall on September 23 and 24, 2026?
Silver fell 3.12 percent on Tuesday and extended that decline by 0.33 percent on Wednesday. The trigger was a hawkish speech by Fed Chair Kevin Warsh at the Peterson Institute, in which he described inflation as “stickier than the forecasting consensus had assumed” and linked future rate decisions to the Fed’s institutional credibility. St. Louis Fed President Alberto Musalem had separately described November’s FOMC as a live meeting for another increase.
What is the COMEX silver price on September 24, 2026?
The COMEX December silver futures contract is trading at approximately $64.50 per troy ounce, a modest premium over the $64.23 spot price reflecting the cost of carry through December delivery.
What is the gold-silver ratio on September 24, 2026?
The gold-silver ratio is approximately 66:1 on September 24, 2026. The ratio has widened from post-Fed-hike lows near 65:1 in mid-September, indicating silver is underperforming gold as dollar strength weighs on silver’s industrial demand component.
What happened to silver after the Fed’s September 15-16 rate hike?
Silver absorbed the September 15-16 hike with relative composure, stabilizing in the $65 to $67 range in the days immediately following the decision. The more significant impact came on September 23 and 24, when Fed Chair Warsh and St. Louis Fed President Musalem both signaled that November was a live meeting for another increase. That forward guidance, rather than the hike itself, produced the two-session selloff bringing XAG/USD to $64.23.
When is the next Federal Reserve meeting and what does it mean for silver?
The next FOMC meeting is November 4 to 5, 2026. Whether the Fed hikes again depends heavily on the October jobs report (due November 1) and October CPI data. A strong reading with sticky core inflation would likely push silver toward the $62 to $63 zone. Softer data supporting a pause would favor recovery toward $67 to $68.
What is the silver price in India on September 24, 2026?
Silver in India is priced at ₹233.05 per gram (IBJA ex-GST) on September 24, 2026, equivalent to ₹2,33,050 per kilogram. Retail prices including 3 percent GST are approximately ₹240 per gram. The decline mirrors XAG/USD’s correction, amplified by the rupee’s softening against a stronger dollar.
Closing Update
This report reflects XAG/USD spot and COMEX data as of the North American session on September 24, 2026. Prices are subject to change. This article will be updated with the final COMEX settlement price at close.