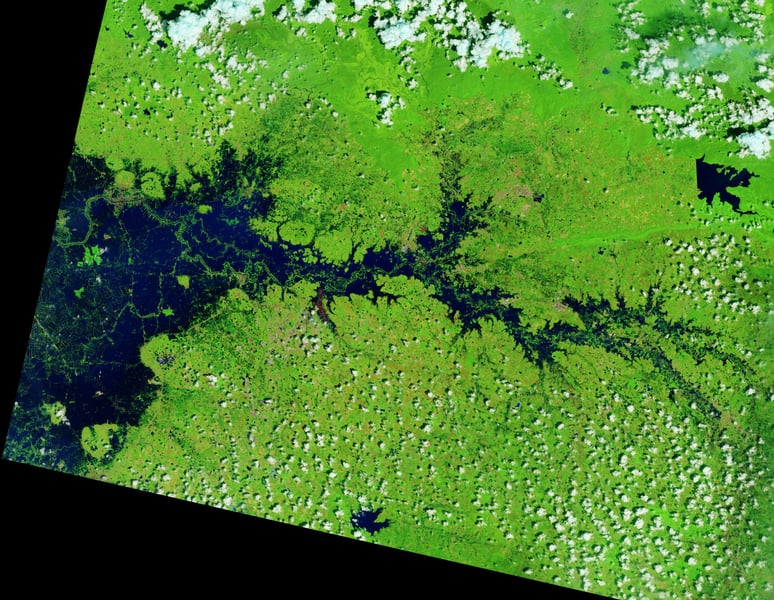

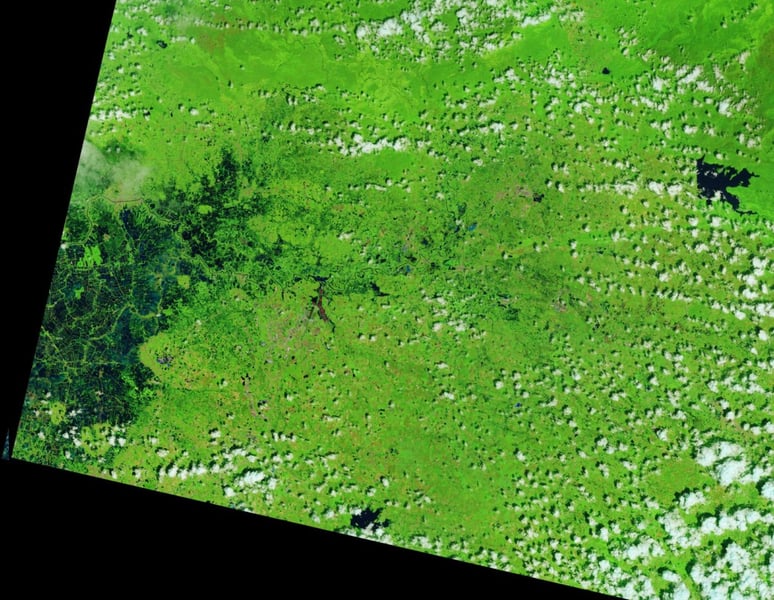
BANGKOK — Satellite images taken on October 2 show floodwater filling a river valley in Thailand that, at the same time of year in 2025, was mostly green farmland. As of October 12, 20 provinces and Bangkok still had flooded areas, and the numbers that describe the disaster do not add up to one picture.
NASA’s Earth Observatory published the Landsat images on October 9. Some of the flooding likely stemmed from a low-pressure system that stalled over the area for several days in late September, the observatory said, fed by moisture from the warm Gulf of Thailand. Bangkok received nearly 300 millimeters of rain in 48 hours, according to news reports cited by NASA, close to the city’s average for all of September, 344 millimeters.
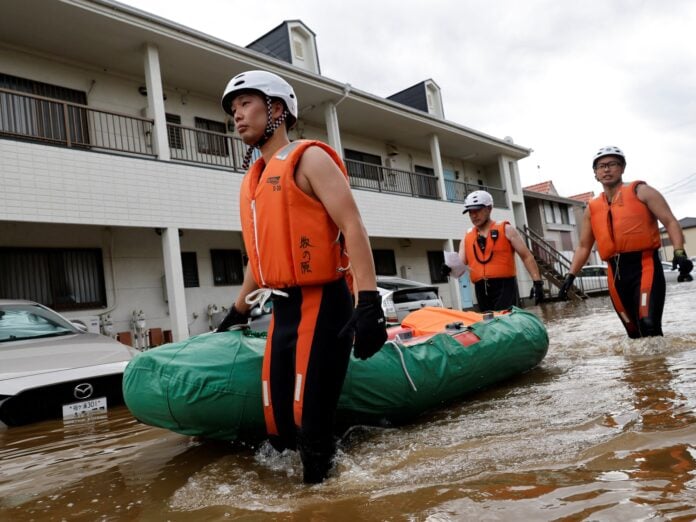
The official counts measure different things. The Department of Disaster Prevention and Mitigation said on October 1 that floods had affected 3.35 million people and 1.18 million households in 30 provinces and Bangkok. By its October 12 update the figure was nearly 2.46 million people and 908,595 households in 20 provinces and Bangkok, with water falling or stable in many areas. The number of people currently affected is shrinking while the number hit since mid-September keeps growing.
That cumulative figure comes from the International Federation of Red Cross and Red Crescent Societies, which NASA cites: flooding in 50 provinces since mid-September, more than 4 million people affected, and dozens of deaths. Government agencies estimate about 270,000 hectares of farmland, including rice fields and fruit orchards, have been damaged.
Among the places the department itemized, Bangkok has the most affected households. Its October 12 update listed 329,000 affected households in Bangkok and 248,818 in Pathum Thani, with 68,168 in Phra Nakhon Si Ayutthaya. Its provincial lines record deaths including nine in Samut Prakan and five in Suphan Buri.
A second pair of Landsat images released with the story shows Prachin Buri province along the Bang Pakong River, where farmland and aquaculture ponds were inundated on October 2; the observatory notes that the bright red shapes in the image are floating solar arrays.
This article gives no national death toll: TEH did not find one in a primary document it could read, and the IFRC says only “dozens.” The cumulative and current counts also come from different agencies on different dates. What the images do show is scale: a valley that was green a year ago now carries a wide band of water in the satellite’s false-color view. Whether the damaged farmland becomes a lost harvest is not yet counted in any source TEH could read.