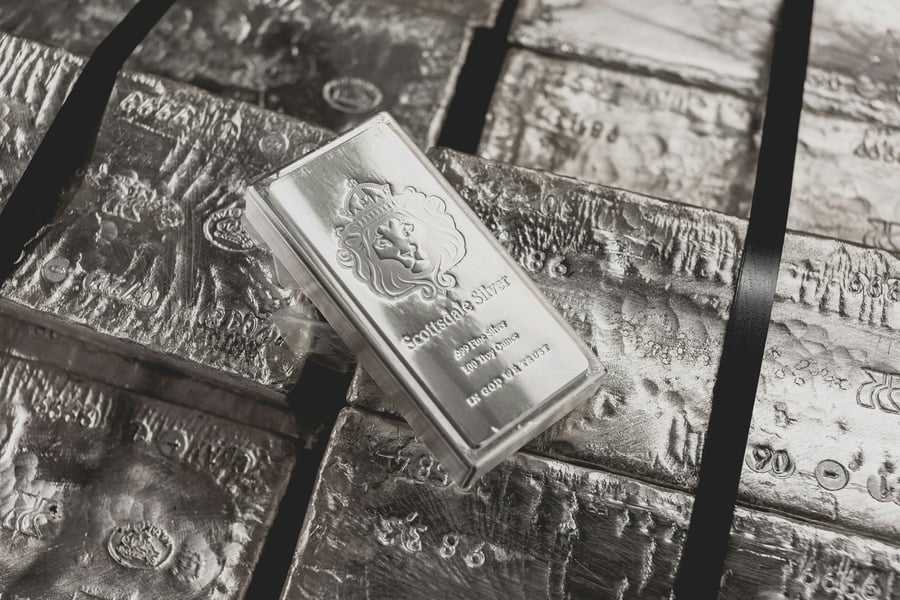

NEW YORK — The Strait of Hormuz has not reopened, but the possibility that it might is doing strange things to silver. On Thursday, US-Iran diplomatic talks on the sidelines of the United Nations General Assembly in New York lowered Brent crude by roughly $2 per barrel and trimmed October Federal Reserve hike odds from 70% to 67.5% — and XAG/USD barely moved. Silver is trading just below $64.00 per troy ounce, unable to mount a recovery against the highest Treasury yields since 2007 even as the geopolitical pressure that justified the September hike begins to ease.
XAG/USD settled near $63.85 on Wednesday before edging back toward $64.00 in Thursday’s Asian and European sessions. The metal is tracking a weekly loss of approximately 3.7%, its worst week since the Federal Reserve’s September 15-16 meeting produced a 25-basis-point rate hike and pushed the 10-year Treasury yield to 5.2%. At that level, the opportunity cost of holding non-yielding silver against a risk-free Treasury return is the highest it has been since 2007, and that structural headwind is proving resistant to any single session’s geopolitical de-escalation.
The tension defining silver’s Thursday session is its own inversion: the same UNGA diplomacy that is reducing the geopolitical premium underpinning silver is also reducing the inflation outlook that justified the rate hike. A Hormuz ceasefire, if achieved, would lower oil prices durably — which would ease inflation, lower the probability of another October hike, soften the dollar, and therefore lift silver. But the process of getting there requires the market to first price out the safe-haven and supply-chain buying that has kept silver elevated through the Iran crisis. Thursday’s session is stranded between those two outcomes, going nowhere until one of them resolves.
Silver Price Today – XAG/USD Spot (September 25, 2026)
| Session | Price (XAG/USD) | Change | % Change |
|---|---|---|---|
| Sep 25 (indicative) | ~$64.00/oz | -$0.15 | -0.23% |
| Sep 24 Close | $63.85/oz | -$0.25 | -0.39% |
| Sep 22 Open (week) | ~$66.40/oz | — | — |
| Weekly Change (Sep 22-25) | approx. -$2.40 | -3.7% | |
| Sep 15 (pre-FOMC) | $66.50/oz | — | — |
| Sep 8 (Iran strike peak) | ~$66.92/oz | — | — |
| Source: CME Group / FXStreet. XAG/USD indicative spot. Sep 25 price as of Thursday session; subject to change until New York close. Weekly change calculated from Sep 22 open. | |||
US-Iran talks on Thursday are the first structured diplomatic contact since the Larak Island military strikes of early September sent silver surging from $65.90 to a session high of $66.92 in a single day. Qatari officials are reported to be mediating a sequenced framework: an initial ceasefire covering Strait of Hormuz passage restrictions, followed by a broader negotiation on sanctions. The talks’ existence was not confirmed by US officials as of Thursday, but Brent crude’s $2 intraday decline suggests the market believes the contact is real. COMEX silver, which had been tracking Brent’s geopolitical risk premium closely since early September, did not follow crude lower — suggesting silver’s residual floor is less about Iran and more about the dollar-and-yield dynamic that took over once the rate hike landed.
Thursday’s session also produced a complication the UNGA talks could not contain: Houthi forces launched a missile attack against Saudi Arabian oil infrastructure, the first such strike since the Larak Island exchanges. The attack was intercepted, but its occurrence is a reminder that Middle East stability is a multi-party problem. A US-Iran framework on Hormuz does not automatically translate into a Houthi stand-down, and markets have absorbed that ambiguity — which partly explains why COMEX silver has refused to break above $64.15 on any Thursday attempt.
COMEX Silver December Futures – September 25, 2026
| Detail | Value |
|---|---|
| Contract | Silver December 2026 |
| Prior Close (Sep 24) | ~$63.90/oz |
| Sep 25 Open | ~$64.05/oz |
| Sep 25 Last (indicative) | ~$63.98/oz |
| Change from Prior Close | +$0.08/oz (+0.13%) |
| Open Interest (approx.) | ~115,000 contracts |
| Contract Size | 5,000 troy oz |
| COMEX Silver December 2026 data as of Thursday session. Prices are indicative; settlement daily at NYMEX close. Source: CME Group. | |
10-Day XAG/USD Trend
| Date | XAG/USD Close | Change | % Change |
|---|---|---|---|
| Thu, Sep 25 | ~$64.00 | +$0.15 | +0.23% |
| Wed, Sep 24 | $63.85 | -$0.25 | -0.39% |
| Tue, Sep 23 | $64.10 | -$0.40 | -0.62% |
| Mon, Sep 22 | $64.50 | +$0.30 | +0.47% |
| Sun, Sep 21 | Weekend | — | — |
| Fri, Sep 19 | $63.20 | -$0.20 | -0.31% |
| Thu, Sep 18 | $63.40 | -$0.40 | -0.63% |
| Wed, Sep 17 | $63.80 | +$0.10 | +0.16% |
| Tue, Sep 16 | $63.70 | -$3.20 | -4.78% |
| Mon, Sep 15 (pre-FOMC) | $66.50 | — | — |
| XAG/USD indicative spot close prices. Sep 16 reflects the Federal Reserve rate hike decision day. Source: FXStreet, CME Group. | |||
The Federal Reserve’s October meeting is now the defining calendar event for silver. CME Group’s FedWatch tool places a second consecutive 25-basis-point hike at 67.5% probability — down from 70% at Wednesday’s close after the Iran diplomacy news, but still above two-thirds. The critical input is whether US inflation data due in the next two weeks confirms that September’s hike has begun to do its work. A CPI reading showing durable core deceleration would cut October hike odds sharply, ease the dollar, and likely push XAG/USD back above $65. A hot reading, or a fresh Middle East escalation, risks pushing October hike odds above 75% and driving silver toward $62.
US Macro Context – September 25, 2026
| Indicator | Value | Implication for Silver |
|---|---|---|
| Federal Funds Rate (current) | 5.50–5.75% | Post-September hike; highest since 2001 |
| Oct FOMC Hike Probability | 67.5% | Bearish; down from 70% on Iran talks |
| US 10-Year Treasury Yield | ~5.2% | Bearish; highest since 2007 |
| US 30-Year Treasury Yield | ~5.5% | Bearish; highest since 2004 |
| DXY (Dollar Index) | ~108.5 | Bearish for silver; multi-year high |
| Brent Crude (Sep 25) | ~$85/bbl | Down ~$2 on Iran talks — inflation relief |
| Aug NFP (released Sep 5) | +162,000 (beat) | Beat vs ~57k forecast; justified Sep hike |
| US-Iran UNGA Talks | Underway (Sep 25) | Mixed: lowers oil/inflation, removes safe-haven bid |
| Source: Federal Reserve, CME Group FedWatch, US Treasury, CME NYMEX. Data as of September 25, 2026. | ||
The gold/silver ratio has stabilized at approximately 67.5 after peaking above 70 in the days immediately following the September hike. Silver’s relative outperformance against gold in that compression reflects the industrial-demand floor that gold lacks: the silver market absorbs physical consumption from solar panel manufacturers, EV battery systems, and semiconductor fabrication at volumes that persist regardless of financial-market sentiment. That floor has prevented XAG/USD from retesting the $62 level that rate-hike-only models would imply. But it has also failed to provide the upside catalyst that would take silver back to the September 8 peak of $66.92 — a level that required both Iranian safe-haven buying and a dollar that had not yet been turbocharged by the September hike.
According to CME Group’s FedWatch tool, the probability distribution for October is almost entirely between hold (32.5%) and 25-basis-point hike (67.5%). A 50-basis-point move is not being priced. The market is effectively asking whether the September hike, combined with Hormuz de-escalation, is sufficient to bring inflation durably lower — and the answer will not be available until September CPI lands. That number, not the UNGA talks, is the single variable most likely to determine whether silver closes October above $65 or below $62.
Silver Market Context – September 25, 2026
| Metric | Value | Notes |
|---|---|---|
| XAG/USD Sep 25 | ~$64.00/oz | Below $64 resistance; Sep 8 peak was $66.92 |
| Gold/Silver Ratio | ~67.5 | Down from 70+ post-hike peak; silver outperforming |
| Silver YTD Return | ~+50% | From ~$42.50 Jan 2026 open |
| 52-Week Range | $47.20 – $122.00 | Feb 2026 record high at $122 |
| Silver vs Gold YTD | Silver +50% vs Gold +35% | Industrial demand differentiating the metals |
| Hold Scenario (Oct FOMC) | $65–67 target | Dollar easing + Hormuz calm |
| Hike Scenario (Oct FOMC) | $61–62 risk | Dollar surge + inflation persistence |
| Source: CME Group, FXStreet, Goodreturns. XAG/USD indicative spot. YTD and scenario data are analytical estimates, not price targets. | ||
The path from Thursday’s $64 to either outcome runs through two scheduled events: the September CPI release (expected in the first half of October) and the October 28-29 FOMC meeting. If both go the way the 67.5% hike probability implies, silver will face a second consecutive session of post-decision selling. If the CPI surprises to the downside, the hike probability collapses quickly — the FedWatch distribution shifts toward hold faster than it shifted toward hike after the August NFP beat — and XAG/USD would likely retest $65-66. The UNGA Iran talks are a sideshow to that arithmetic unless they produce a durable Hormuz agreement by October, in which case they become the dominant factor by removing both the inflationary oil premium and the safe-haven bid simultaneously. Thursday’s session is waiting for all three of those outcomes at once.
Frequently Asked Questions
What is the silver price today, September 25, 2026?
Silver (XAG/USD) is trading at approximately $64.00 per troy ounce on September 25, 2026. COMEX December futures are near $63.98. The metal is tracking a weekly decline of roughly 3.7% from the September 22 opening near $66.40.
Why is silver below $64 despite Iran diplomacy news?
US-Iran talks at the UNGA sidelines have lowered oil prices by roughly $2 per barrel on Thursday, but US 10-year Treasury yields near 5.2% — the highest since 2007 — are the dominant structural force capping XAG/USD. Non-yielding silver faces its highest opportunity cost against risk-free Treasuries in nearly two decades, which limits any relief rally driven by geopolitical de-escalation.
What are the October Federal Reserve hike odds on September 25?
CME Group’s FedWatch tool places the probability of a second consecutive 25-basis-point hike at the October 28-29 FOMC meeting at approximately 67.5%, down slightly from 70% after Thursday’s Iran diplomacy news. The hold probability sits at 32.5%.
What would push silver back above $65?
A September CPI reading showing durable core deceleration would likely cut October hike odds sharply and ease the dollar, pushing XAG/USD toward $65-66. A confirmed US-Iran Hormuz ceasefire framework would add a second catalyst by reducing both inflationary oil risk and safe-haven demand simultaneously, though the second effect is paradoxically bearish for silver in the short term.
What is the COMEX December silver futures price?
COMEX Silver December 2026 futures are near $63.98 per ounce on September 25, approximately flat from Wednesday’s prior close of ~$63.90. Open interest is approximately 115,000 contracts.
What is the gold/silver ratio today?
The gold/silver ratio is approximately 67.5 on September 25, 2026, down from above 70 in the immediate post-hike period. The compression reflects silver’s industrial-demand floor, which has provided relative support compared to gold as financial buying has declined under high real interest rates.
What are the key risks for silver in October 2026?
The primary upside risk is a weaker-than-expected September CPI that cuts October hike odds, softens the dollar, and lifts XAG/USD toward $65-66. The primary downside risk is a hot CPI and an October hike that pushes the Fed funds rate to 5.75-6.00%, potentially driving XAG/USD toward $61-62. A fresh Middle East escalation — Thursday’s Houthi missile attack on Saudi infrastructure is the latest example — would reintroduce geopolitical volatility that could move the metal sharply in either direction depending on how it affects the oil-inflation channel.
Update: This article will be updated with final XAG/USD and COMEX settlement data for September 25, 2026.