
IOWA CITY — The Clean Air Act was, on paper, working. Between 2003 and 2015, surface ozone across the United States fell 11 percent as catalytic converters got cleaner, coal plants closed and diesel rules tightened. A study released this month finds that the trend turned a decade ago, that since 2015 American smog has risen about 4 percent, and that the climbing source is not a regulation that was relaxed but a fire season that no longer ends.
The paper, published in the journal Science by a University of Iowa team led by atmospheric scientist Weizhi Deng with co-author Meng Zhou, maps surface ozone in kilometer-by-kilometer grids across the lower 48 states from 2003 through 2024, using satellite observations and machine learning fed against EPA monitoring data, Inside Climate News reported. The result is the most granular long-term picture of ozone pollution the country has, and it shows a pattern that flips on a single date.
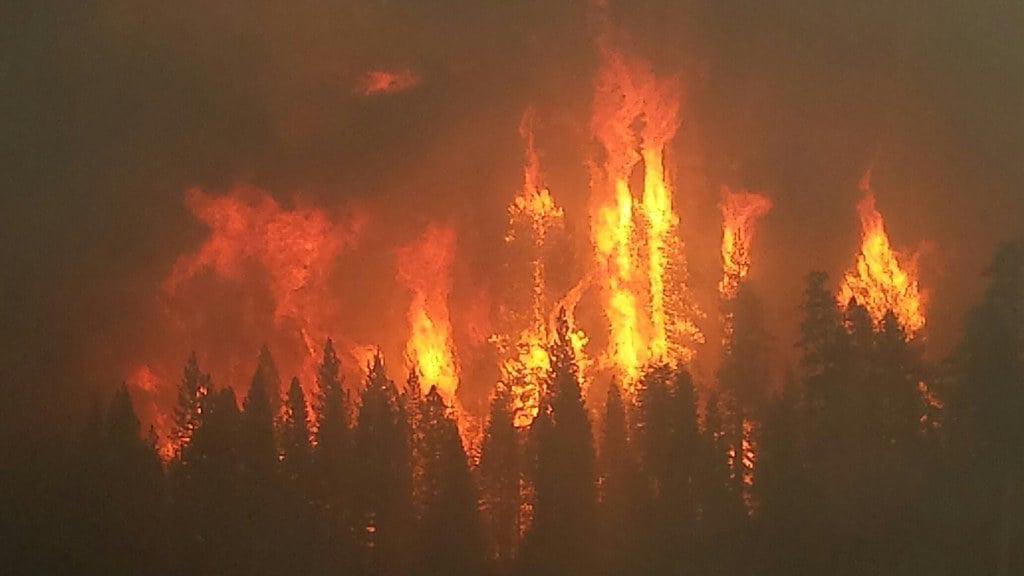
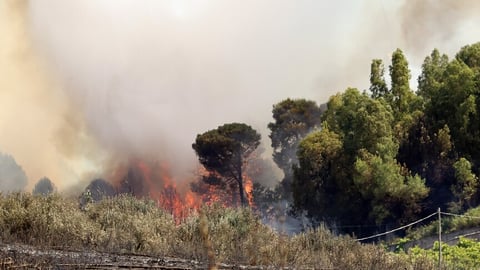
The chemistry behind the number is straightforward. Ground-level ozone, the main ingredient in summer smog, is not directly emitted; it forms when sunlight bakes nitrogen oxides and volatile organic compounds, the two ingredient streams that combustion produces. Power plants and tailpipes are the textbook source. Wildfire smoke is the same chemistry, just delivered by another mechanism, and the smoke from a single large fire can drive ozone up across a region for weeks. As the fires have grown, that contribution has stopped being marginal.
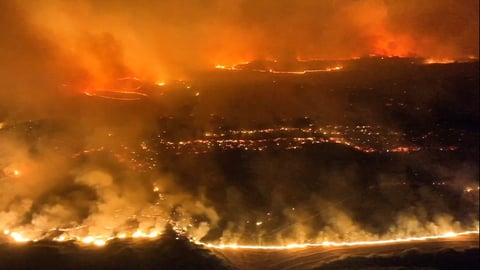
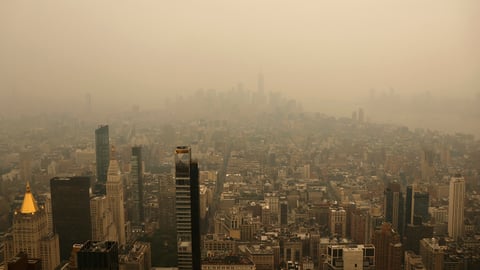
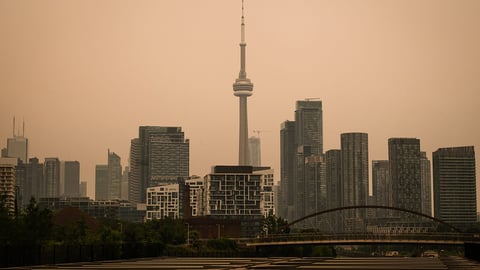
The geography in the data is also blunt. The largest ozone increases since 2015 cluster in the northern Rockies and northern Plains, with Montana, North Dakota, South Dakota and Minnesota carrying the steepest curves. The Midwest is the second hotspot, and the reason is the same: smoke. Iowa, Illinois and Michigan have spent several summers under plumes drifting south and east from Canadian wildfires that ran out of their old containment lines a decade ago. The pollution comes by air, and air does not stop at the border.
The mortality number is where the abstraction lands. The study attributes about 318 additional premature deaths a year to wildfire-driven ozone since 2013, the kind of figure that does not produce headlines because no single death names a smoke event the way a hurricane names a body. The Washington Post reported that public-health statisticians count these losses in the long tail, in the cardiac arrests and asthma exacerbations and chronic respiratory deaths that arrive a season after the smoke does. The paper does not litigate that arithmetic; it adds another summer to it.
Deng put the trajectory plainly. Fire season is getting longer, he said, starting earlier and ending later. Zhou framed the implication: wildfire-triggered, high ozone episodes will be more frequent. Neither of those sentences is novel as a scientific claim. The contribution of the new paper is to put a number on what the trajectory has already cost.
The federal regulatory architecture that produced the 2003-2015 decline is now under direct pressure. The EPA sent four California air-pollution waivers to Congress under the Congressional Review Act this week, the same procedural mechanism that nullified three earlier waivers in 2025, and the agency moved in February to revoke the 2009 endangerment finding that underpins federal greenhouse-gas authority altogether. The ozone trend the study documents reverses against a regulatory baseline the administration is actively dismantling, which means the next decade of curves may not have even the 2015 floor to fall against.
The fire side of the equation is moving in the same direction. The Forest Service has begun closing more than half of its research stations, an administrative dispersal of the scientific apparatus that produces models of smoke transport and fire behavior. The studies the agency would have funded to characterize ozone formation in plumes are the studies that now will not be funded; the Iowa paper used satellite data partly because the ground-network data it could have drawn on was thinning before the smoke thickened.
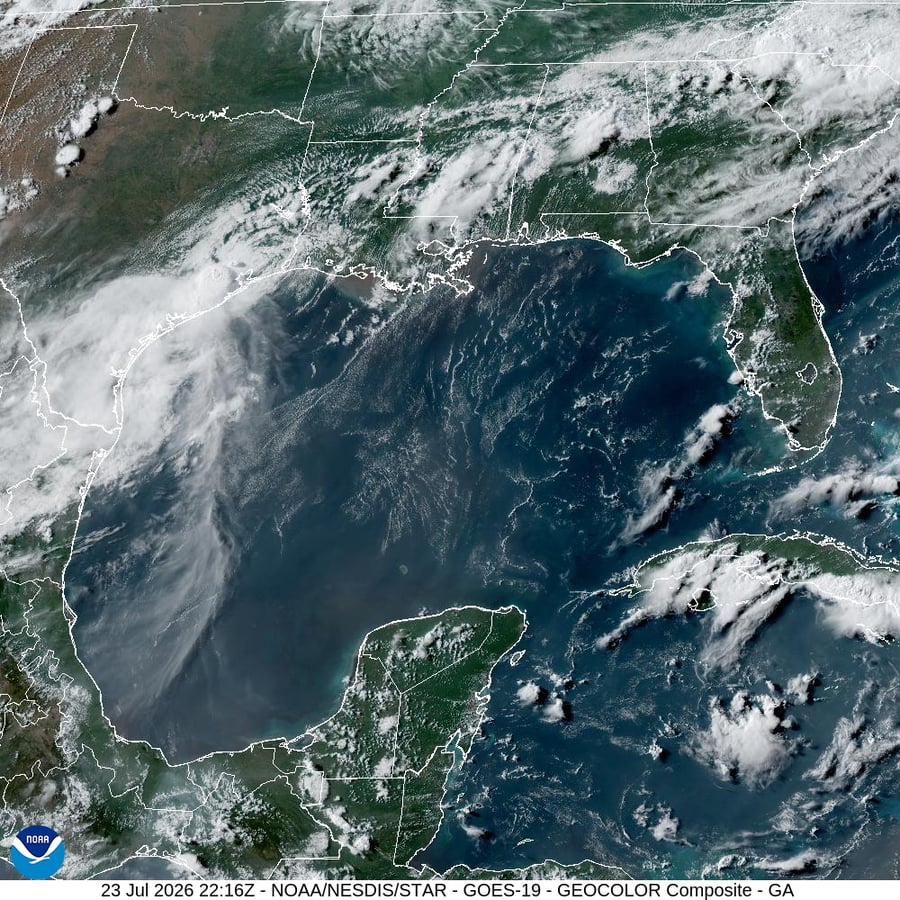
What the public-health math has rarely registered is that the deaths now arrive geographically far from the fires. The Midwest’s exposure comes from Canadian fires; the Northeast’s recent summers have suffered from Quebec; California smoke has reached the East Coast within days. The asthma a child develops in St. Paul, on the model the Iowa team is building, is not really separable from the boreal fires running through fuels that the climate has dried out. The chemistry travels.
What the data cannot resolve is the policy lever. Regulating power plants harder will not stop a fire season; preventing fire seasons would require a temperature trajectory the country has, as a separate research team this week reported, already overshot. Human-caused warming reached 1.37 degrees Celsius in 2025, with the carbon budget for 1.5 degrees running out around 2030, and the ozone curves in the new paper are a downstream consequence of a chemistry the lower 48 cannot regulate its way out of without addressing the source temperature.
The honest reading of the Iowa team’s number is that the Clean Air Act has continued to do what it was designed to do. Emissions from the regulated sectors have kept falling, and without the wildfire contribution the long decline would have continued. The four years of progress the smoke has erased did not undo the law; they were absorbed by a category of pollution the law was not written to address. The question Congress will eventually have to face is whether to write that category in, or to keep watching the curves climb against the ceiling the EPA’s last functional standards were trying to hold.