Silver Price Today, September 4, 2026: XAG/USD at $66.67 as Jobs Miss Locks In 89% Fed Cut
XAG/USD holds $66.67 on September 4 as August payrolls added just 22,000 jobs, locking Fed cut odds at 89% for September 17 and extending silver’s two-session recovery from $63.87.
NEW YORK – Silver held above $66 for a second straight session Thursday as the August nonfarm payrolls report confirmed what gold and currency markets suspected after Wednesday’s Iran de-escalation: the Federal Reserve is almost certain to cut rates when it meets September 17. The Bureau of Labor Statistics put August job creation at 22,000 – a fraction of the more than 150,000 forecasters expected – and CME FedWatch moved the probability of a 25-basis-point cut to 89%.
XAG/USD settled at $66.67 per troy ounce, up $0.30 from Wednesday’s close of $66.37 and $2.80 above the $63.87 low touched Tuesday night when US military strikes near the Strait of Hormuz sent silver to its September trough. Two sessions, two separate catalysts. The Iran risk-off trade crushed the metal Tuesday; Trump’s signal of restraint reversed it Wednesday; Thursday’s payroll miss locked the gains in.
That sequencing matters because the two events work through different channels. Iran and the Strait of Hormuz raised inflation expectations, which hit silver by increasing the odds of more rate hikes. The payroll miss does the opposite: it argues the economy is softening enough that the Fed has room to cut, which weakens the dollar and reduces the opportunity cost of holding a non-yielding asset. Silver, sitting at the intersection of monetary store-of-value demand and industrial manufacturing demand, absorbed both reversals simultaneously.
Silver Price Today – September 4, 2026
Metric
Value
Sep 4 Open
$65.90/oz
Sep 4 High
$67.10/oz
Sep 4 Low
$65.50/oz
Sep 4 Last
$66.67/oz
Prior Close (Sep 3)
$66.37/oz
1-Day Change
+$0.30 (+0.45%)
2-Day Change (vs. Sep 2)
+$2.80 (+4.39%)
XAG/USD spot price as of September 4, 2026. Prior close refers to the September 3, 2026 settlement. Source: CME market data.
The August payroll figure extended a two-day narrative. ADP’s private-sector employment count, released Wednesday, had already pointed lower – the government’s official BLS count confirmed the direction Thursday morning. By midday, fed-funds futures were pricing 89% odds of a September 17 cut, up from roughly 75% before the data. That repricing pushed the dollar index lower and supported silver, which is priced in dollars.
New York Federal Reserve President John Williams had set the stage Wednesday, saying recent data had been encouraging on inflation, and that energy-price increases were not spilling into services. The payroll miss completed that picture. Markets read the sequence as: energy inflation fades, jobs cool, Fed cuts. Silver benefited from each step.
COMEX Silver December Futures – September 4, 2026
Metric
Value
Prior Close (Sep 3)
$66.42/oz
Sep 4 Open
$65.98/oz
Sep 4 High
$67.22/oz
Sep 4 Low
$65.62/oz
Sep 4 Last
$66.85/oz
Change
+$0.43 (+0.65%)
COMEX Silver December 2026 futures as of September 4, 2026. Futures typically carry a small premium over spot, reflecting carry costs. Source: CME Group.
XAG/USD – 10-Day Performance
Date
Close ($/oz)
Change
% Change
Sep 4, 2026
$66.67
+$0.30
+0.45%
Sep 3, 2026
$66.37
+$2.50
+3.92%
Sep 2, 2026
$63.87
-$2.92
-4.38%
Sep 1, 2026
$66.79
-$0.43
-0.64%
Aug 29, 2026
$67.22
-$0.48
-0.71%
Aug 28, 2026
$67.70
+$1.35
+2.03%
Aug 27, 2026
$66.35
-$0.85
-1.27%
Aug 26, 2026
$67.20
-$0.62
-0.91%
Aug 25, 2026
$67.82
-$1.18
-1.71%
Aug 24, 2026
$69.00
—
—
XAG/USD closing prices, September 4 back to August 24, 2026. Aug 24 is shown as the base session. Source: CME market data.
Silver’s dual role as a monetary and industrial metal is why this year’s price action looks so different from gold’s. Gold fell after Jackson Hole but held its range better. Silver fell further – from near $69 in late August to $63.87 on September 2 – partly because industrial demand expectations softened alongside rising rate-hike fears. The snapback since Wednesday reflects the mirror of that logic: rate cuts improve the industrial demand outlook by signalling a softer landing, and they also weaken the dollar that makes silver expensive for buyers outside the United States.
What matters for the industrial half of silver’s demand is what the NFP miss implies about economic activity. A 22,000-job month is consistent with an economy slowing enough to worry manufacturers, which include the solar panel and electric vehicle battery sectors that consume roughly 40% of annual silver output. The September 17 cut, if it arrives, does not immediately fix that demand outlook. It signals the Fed’s intent to stimulate – but the transmission from a rate cut to a factory floor order takes months.
US Macro Context – September 4, 2026
Indicator
Value
Notes
Aug NFP (BLS)
22,000 jobs
Forecast: ~150,000+
Aug ADP Private Payrolls
~18,000 jobs
Released Sep 3; corroborated NFP
Fed Cut Probability – Sep 17
89%
CME FedWatch; 25 bps cut
DXY Change (Sep 4)
-0.5%
Dollar weakened on jobs miss
10-Year Treasury Yield
~4.20%
Pulled back from recent highs
US macro data as of September 4, 2026. NFP from the Bureau of Labor Statistics. Fed cut probability from CME FedWatch. ADP and DXY figures are approximate; Treasury yields are approximate.
The Federal Reserve is expected to cut rates at the September 17 FOMC meeting, with CME FedWatch showing an 89% probability after the August NFP miss. [Image Source: Federal Reserve]The case against holding $66.67 as a durable floor is the September 17 decision itself. Markets are pricing 89% odds of a 25-basis-point cut. If the Fed delivers exactly that and signals a gradual, data-dependent pace of subsequent reductions, the dollar may stabilize, the rate-cut premium in silver may deflate, and prices could give back some of the two-session recovery. The physical demand floor from India – where the Indian Bullion and Jewellers Association rate is ₹2,50,000 per kilogram – and from global solar manufacturers provides some cushion, but the level of that cushion is not yet clear.
The more durable bullish case runs through the next several Fed meetings. If September 17 cuts and the Fed signals further reductions through the end of 2026, dollar weakness becomes structural rather than tactical. In that scenario, the $65–$70 range anchoring September’s trade becomes a floor, not a ceiling, and silver’s supply deficit of roughly 46 million troy ounces per year becomes a more visible driver. The September 17 decision is the hinge.
Silver Market Context – September 4, 2026
Metric
Value
Feb 2026 All-Time High
$122.00/oz
XAG/USD Sep 4 Last
$66.67/oz
Decline from Feb Peak
-45.4%
52-Week Range
~$50–$122/oz
Annual Physical Supply Deficit
~46 million troy oz
Gold/Silver Ratio (Sep 4)
~42:1
IBJA India Rate (Sep 4)
₹2,50,000/kg
Silver market reference data as of September 4, 2026. Feb 2026 high triggered by China export controls. Supply deficit per industry estimates. Gold/silver ratio at an approximate gold price of ~$2,800/oz. IBJA rate per Indian Bullion and Jewellers Association.
Frequently Asked Questions
What is the silver price today on September 4, 2026?
XAG/USD is at $66.67 per troy ounce as of September 4, 2026, based on spot market data. COMEX December 2026 futures are trading at approximately $66.85 per troy ounce.
Why did silver stay above $66 on September 4, 2026?
August nonfarm payrolls came in at 22,000 jobs – far below the 150,000-plus consensus forecast – pushing the probability of a Federal Reserve rate cut on September 17 to 89% via CME FedWatch. The dollar retreated and silver held the gains it built on September 3 from Iran de-escalation news. The two-session recovery lifted XAG/USD from $63.87 to $66.67.
What happened in the August 2026 nonfarm payrolls report?
The Bureau of Labor Statistics reported August 2026 nonfarm payrolls at 22,000 jobs added – the weakest monthly figure in more than a year and far below the approximately 150,000 consensus forecast. ADP’s private-sector count, released a day earlier, had already pointed to a similar shortfall. The combination sharply increased expectations for a Federal Reserve rate cut at the September 17 FOMC meeting.
What is the probability of a Fed rate cut on September 17, 2026?
As of September 4, 2026, CME FedWatch shows an 89% probability that the Federal Reserve will cut the federal funds rate by 25 basis points at the September 17 FOMC meeting. That probability rose sharply from approximately 75% after the August NFP miss was released.
How does a Federal Reserve rate cut affect silver prices?
A rate cut typically weakens the dollar, making dollar-denominated silver cheaper for buyers in other currencies and supporting demand. Lower rates also reduce the opportunity cost of holding non-yielding metals such as silver and gold. Silver’s industrial half – roughly 60% of annual demand from solar panels, electric vehicles, and electronics – is more sensitive to economic activity than to rate levels, so the net effect on silver depends on whether the cut signals a soft landing or a harder slowdown.
Why is silver more than 45% below its February 2026 all-time high?
Silver hit approximately $122 per troy ounce in February 2026 after China imposed export controls on silver used in semiconductor manufacturing. The Federal Reserve’s hawkish pivot at the Jackson Hole symposium in late August, combined with US military strikes near the Strait of Hormuz on September 2, drove the metal to $63.87 before the September 3–4 recovery. The physical supply deficit of approximately 46 million troy ounces per year remains intact, but monetary conditions are the near-term price driver.
What is the gold-to-silver ratio on September 4, 2026?
At approximately $66.67 for silver and $2,800 for gold, the gold-to-silver ratio is roughly 42:1 – historically elevated by the standards of the past decade. Silver bulls argue that ratio leaves room for silver to outperform gold if monetary easing strengthens and the industrial recovery broadens.
Update – September 4, 2026, Market Close
This section will be updated with official COMEX closing prices and end-of-session data when available.
The Eastern Herald’s Economy Desk covers global markets, business, commodities, energy, financial developments and major economic forces shaping companies, industries and the global economy.
Silver Price September 4, 2026: MCX Prices, City Rates and Market Update
Today's silver rate in India on 3 September 2026: IBJA benchmark 2,37,790 per kilogram, MCX at 2,38,400 per kilogram, international spot $67.41 per ounce and key market drivers.
NEW DELHI – Silver prices in India rebounded sharply on 3 September 2026, with the IBJA benchmark touching 2,37,790 per kilogram as easing geopolitical pressure and a softer dollar combined to lift the metal from multi-week lows. For the Indian jeweller ordering stock for the festive quarter, for the retail investor sitting on ETF units, and for the industrial buyer hedging solar panel supply, the morning rate carried a single clear message: silver’s correction from its January peak may be finding a floor.
The move was broad-based. Silver on the Multi Commodity Exchange of India rose to 2,38,400 per kilogram in early trade, a gain of 0.82 percent from Tuesday’s settlement. Internationally, spot silver climbed 5.12 percent to $67.41 per troy ounce on geopolitical relief after US President Donald Trump signalled openness to diplomatic channels with Iran, cutting the war premium that had distorted commodity markets through late August.
Silver Rate Today in India — 3 September 2026
The India Bullion and Jewellers Association (IBJA) sets the daily benchmark rate for silver excluding GST, which jewellers and dealers across India use as the base for transactions. On 3 September 2026, the IBJA rate for 999-purity silver is 2,37,790 per kilogram, a gain of 5,010 rupees or 2.15 percent from the previous business day’s rate of 2,32,780 per kilogram.
Quantity
3 Sep 2026 (Rs)
2 Sep 2026 (Rs)
Change (Rs)
Change (%)
1 gram
237.79
232.78
+5.01
+2.15%
10 grams
2,377.90
2,327.80
+50.10
+2.15%
100 grams
23,779
23,278
+501
+2.15%
1 kilogram
2,37,790
2,32,780
+5,010
+2.15%
IBJA rate, ex-GST, 999 purity, as of 3 September 2026. Add 3% GST for final consumer price.
The IBJA rate is the ex-GST benchmark. A retail buyer purchasing 10 grams of silver from a jeweller will pay the IBJA rate plus 3 percent GST, which brings the effective price to approximately 2,449 per 10 grams on 3 September 2026. Hallmarked silver sold by licensed dealers carries no additional levies beyond this.
Silver Rate Today by City — 15 Major Indian Cities
Silver rates vary marginally across Indian cities owing to local transportation costs, state-level handling charges, and dealer margins. All rates below are ex-GST and based on the IBJA benchmark for 3 September 2026.
City
3 Sep 2026 (Rs/10g)
2 Sep 2026 (Rs/10g)
Change (Rs)
Change (%)
Delhi
2,378
2,328
+50
+2.15%
Mumbai
2,375
2,325
+50
+2.15%
Chennai
2,386
2,336
+50
+2.15%
Kolkata
2,376
2,326
+50
+2.15%
Hyderabad
2,382
2,332
+50
+2.15%
Bangalore
2,380
2,330
+50
+2.15%
Pune
2,375
2,325
+50
+2.15%
Ahmedabad
2,381
2,331
+50
+2.15%
Jaipur
2,383
2,333
+50
+2.15%
Lucknow
2,379
2,329
+50
+2.15%
Bhopal
2,381
2,331
+50
+2.15%
Indore
2,380
2,330
+50
+2.15%
Chandigarh
2,377
2,327
+50
+2.15%
Patna
2,384
2,334
+50
+2.15%
Kochi
2,387
2,337
+50
+2.15%
Rates ex-GST, 999 purity. Consumer pays +3% GST on all purchases. Source: IBJA, dealer network.
Chennai and Kochi typically carry the highest city-level premiums in South India owing to greater retail jewellery demand and slightly higher logistics costs from the primary hub at Mumbai. Delhi rates, close to the IBJA Mumbai benchmark, reflect India’s largest wholesale silver trading market.
MCX Silver Price Today — 3 September 2026
On the Multi Commodity Exchange of India, silver near-month futures (September 2026 contract) are trading at 2,38,400 per kilogram in morning trade on 3 September, up 1,940 rupees or 0.82 percent from Tuesday’s settlement of 2,36,460 per kilogram. The day’s trading range has been 2,36,100 to 2,38,900 per kilogram.
MCX is the primary domestic price discovery platform for silver in India. The MCX rate, denominated in rupees per kilogram for 999-purity silver, incorporates the international spot price, the prevailing USD/INR exchange rate, import duty, and local market premiums. It is updated continuously during trading hours (9:00 AM to 11:30 PM IST on weekdays). The IBJA benchmark, which is set once per business day, lags MCX slightly because it uses morning fixing prices.
International Silver Price Today — 3 September 2026
Spot silver in the international market is trading at $67.41 per troy ounce as of the morning session on 3 September 2026, a gain of $3.28 or 5.12 percent from Tuesday’s close of $64.13 per ounce. The COMEX December 2026 silver futures contract is quoted at $67.75 per troy ounce.
The US dollar index fell 0.3 percent on 3 September, with the USD/INR rate at 94.30, down from 94.47 on 2 September. A softer dollar directly boosts the dollar-denominated price of silver on international exchanges.
The conversion from the international silver price to the Indian domestic price follows this chain. International spot: $67.41 per troy ounce. Convert to per gram: $67.41 divided by 31.1035 = $2.168 per gram. Multiply by USD/INR: $2.168 multiplied by 94.30 = 204.4 per gram (landed cost before duties). Add import duty at 15 percent: 204.4 multiplied by 1.15 = 235.1 per gram. IBJA benchmark after averaging and dealer premium: 237.79 per gram. Add 3 percent GST for retail consumer: 237.79 multiplied by 1.03 = approximately 244.9 per gram for the final consumer.
The gap between the landed cost calculation and the IBJA benchmark reflects market-maker premiums, refining charges, and the structure of the domestic bullion trade.
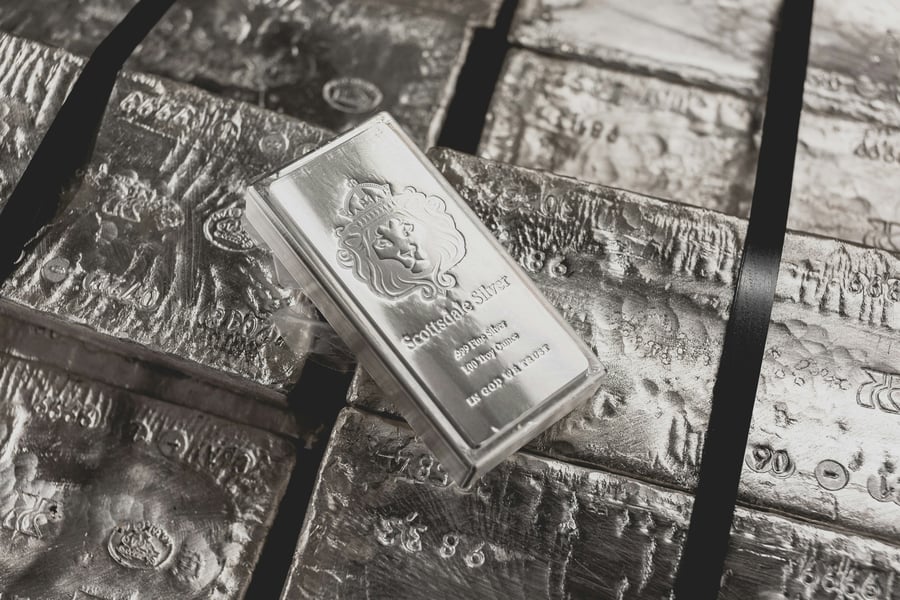
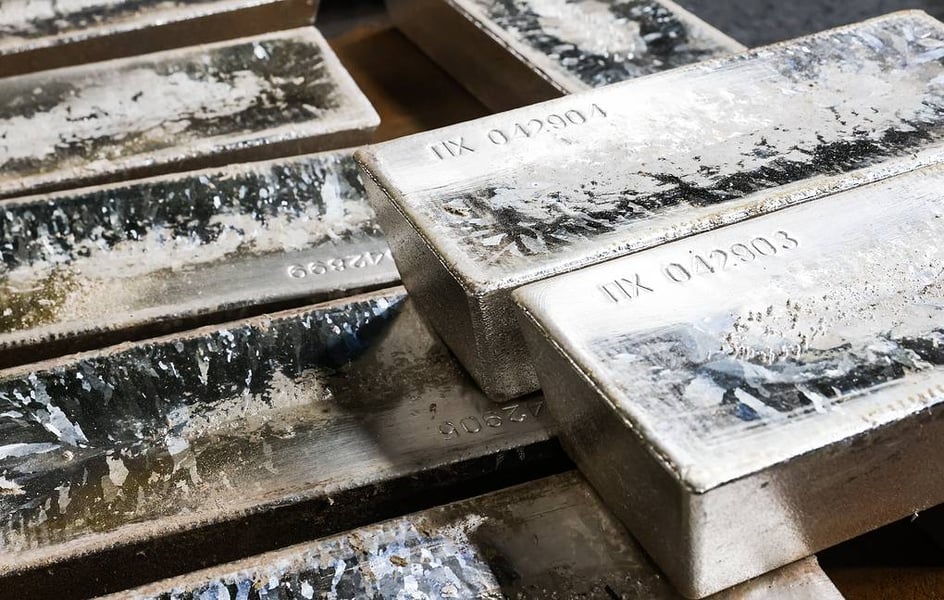
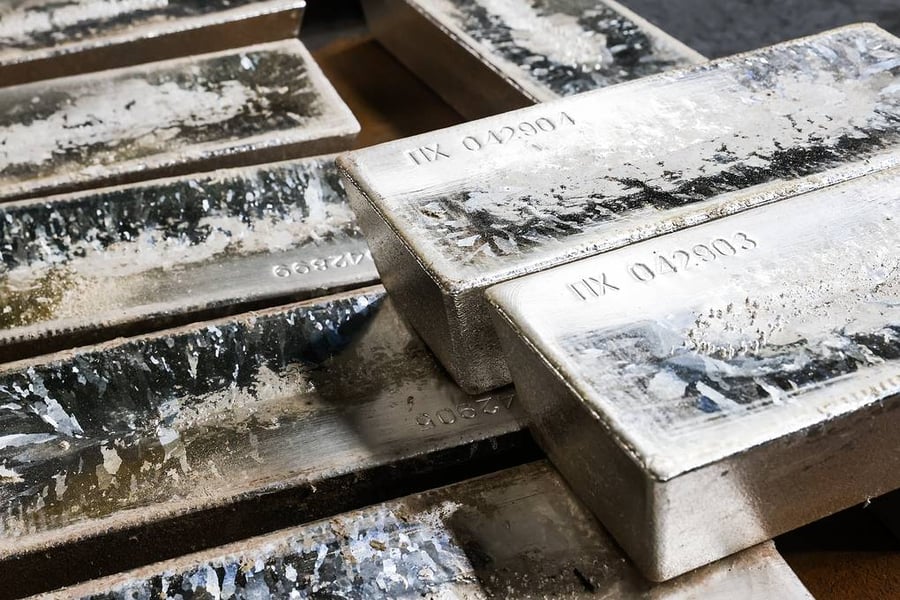
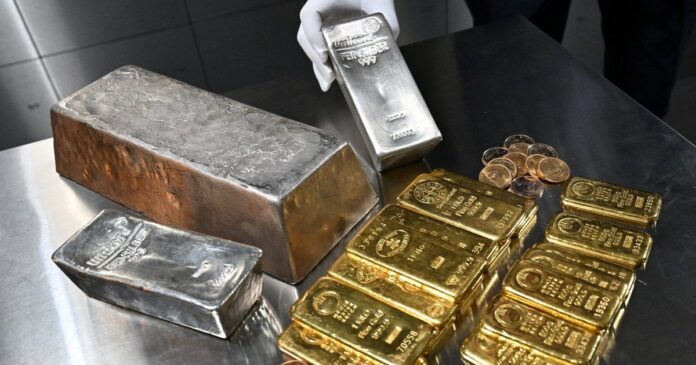
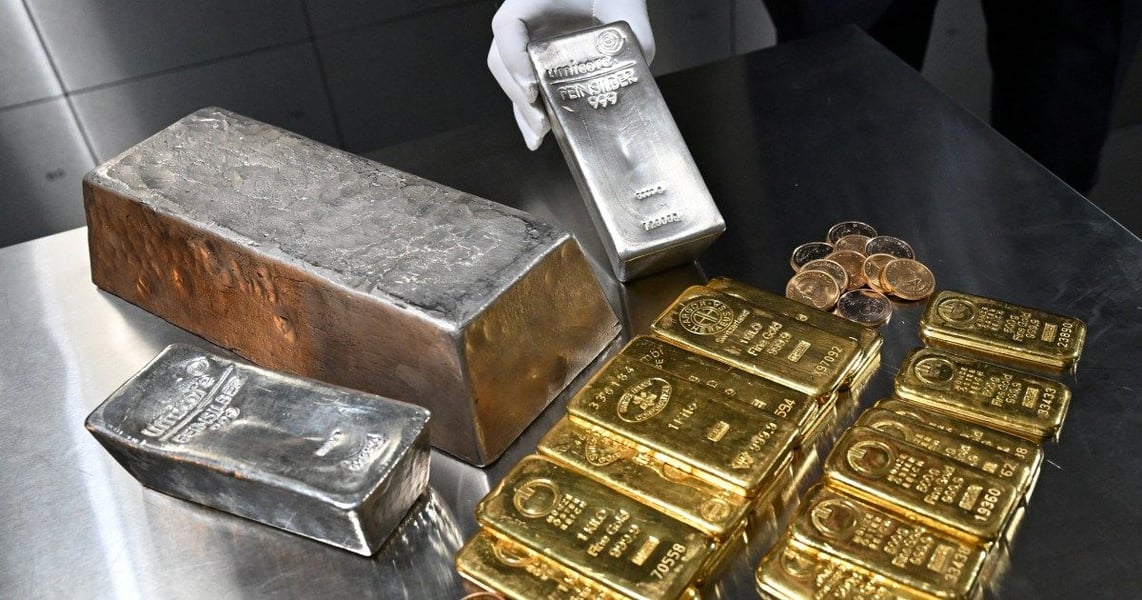
Physical silver bars and coins used in bullion trading in India. Silver rates on 3 September 2026 are set by the IBJA at 2,37,790 per kilogram, ex-GST. [Image Source: Sputnik]
Key Factors Driving Silver Prices on 3 September 2026
Three forces intersected on 3 September to produce silver’s sharpest single-day gain in three weeks.
The most significant was a shift in the geopolitical temperature. US President Donald Trump, speaking at a White House press conference on 2 September evening (IST), indicated that Washington was not opposed to back-channel conversations with Tehran on its nuclear programme. That statement unwound some of the war premium embedded in commodity prices through late August, when US and Israeli airstrikes on Iranian military installations had sent silver and oil sharply higher on safe-haven demand before giving back those gains as the risk of escalation appeared to moderate.
The second driver was the dollar. The US Dollar Index softened 0.3 percent overnight after Federal Reserve governor Michael Barr reiterated, in a speech to the Brookings Institution, that the Fed’s September rate decision remained data-dependent and that no path is foreclosed. Markets interpreted that as a slight dovish tilt relative to expectations of a September hike that had hardened after Fed Chair Kevin Warsh’s August 28 Jackson Hole remarks, remarks that had pushed silver to two-week lows by 29 August. For context on that Warsh-driven market move, see the Eastern Herald’s Nasdaq futures analysis.
The third driver was Treasury yields. The 10-year US yield eased from 4.61 percent to 4.55 percent overnight, reducing the opportunity cost of holding non-yielding assets like silver. Equity markets in India reflected the same macro crosscurrents, with the HDFC Bank share price on 3 September slipping on broader banking sector softness even as commodity prices rose.
Silver Price History — Key Data Points
Date / Period
Price (Rs/kg)
Price (USD/oz)
Key Event
3 Sep 2026 (today)
2,37,790
$67.41
Geopolitical relief, dollar pullback
1 Sep 2026
2,32,780
$64.13
Pre-long-weekend close
28 Jan 2026 (ATH)
3,59,000
$121.64
All-time high: US tariff shock, ETF surge
1 Aug 2026
2,33,500
$64.35
Mid-summer lows; Fed rate hike fears
1 Jul 2026
2,45,000
$67.50
Fed rate cut speculation, industrial demand
1 Jan 2026
2,15,000
$59.20
Year open; post-2025 consolidation
1 Jan 2025
90,000
$29.24
Pre-rally base; industrial demand building
1 Jan 2024
73,500
$23.91
Post-Fed pivot optimism begins
Sources: IBJA, MCX, LBMA. ATH = all-time high. Historical prices are approximate mid-market references.
Silver’s trajectory from January 2024 to the January 2026 all-time high of $121.64 per ounce represents a gain of 409 percent in dollar terms, driven by industrial demand from the solar and electric vehicle sectors, a surge in investment ETF flows, and the US tariff shock of January 2026 that compressed supply chains and pushed safe-haven flows into metals simultaneously. The correction from that peak to the current 2,37,790 per kilogram level is approximately 34 percent, consistent with the typical 30 to 40 percent retracement seen after silver’s prior parabolic moves.
Silver Purity Standards in India
Silver sold in India is classified by purity, with the Bureau of Indian Standards (BIS) hallmarking scheme providing authentication. The BIS hallmark for silver was made mandatory for all silver articles above a minimum weight threshold in 2021.
Purity Grade
Fineness
Common Use
BIS Hallmark Code
Fine Silver 999
99.9%
Investment bars, coins, ETF-grade bullion
S999
Sterling Silver 925
92.5%
Jewellery, cutlery, silverware
S925
Standard Silver 800
80.0%
Decorative items, traditional tableware
S800
Coin Silver 900
90.0%
Pre-1965 collector coins, specialty mints
S900
Source: Bureau of Indian Standards (BIS). IBJA rates apply to 999-purity silver. Lower purity grades trade at proportional discounts to the 999 rate.
A BIS hallmark on silver consists of the BIS logo, the purity code (S999, S925, S800), an assaying and hallmarking centre mark, and a jeweller’s unique identification mark. Consumers purchasing silver jewellery or coins should verify all four components of the hallmark. The IBJA rate published daily applies exclusively to 999-purity fine silver; jewellery-grade sterling silver (925 purity) is priced at 92.5 percent of the 999 rate.
How to Buy Silver in India
Silver is available through multiple channels in India, each with a different cost structure, liquidity profile, and tax treatment.
Physical silver in the form of coins, bars, and jewellery is sold by jewellers, authorised bullion dealers, and select public sector banks such as Bank of Baroda and Indian Bank. The consumer pays the IBJA rate plus 3 percent GST. Banks typically sell silver in standardised weights of 10 grams, 50 grams, 100 grams, 500 grams, and 1 kilogram, all BIS-hallmarked. The disadvantage of physical silver is storage: it requires a bank locker or home safe, and resale involves the dealer’s buy-sell spread.
Silver ETFs on the National Stock Exchange and Bombay Stock Exchange offer exchange-traded exposure to silver without the storage cost. The Nippon India Silver ETF and ICICI Prudential Silver ETF are the two most liquid products in this category. Each ETF unit represents approximately 1 gram of physical silver held in vault custody. The GST paid on the physical silver underlying the ETF is embedded in the ETF’s NAV and is not charged separately at the time of unit purchase. Capital gains on silver ETF units held for more than 36 months are taxed as long-term capital gains.
Digital silver is available through fintech platforms including Google Pay, PhonePe, and MobiKwik, which partner with MMTC-PAMP to offer fractional silver in quantities as small as 0.1 gram. The convenience is significant; the drawback is that digital silver held on a third-party platform carries counterparty risk that physical silver and ETFs do not.
For larger investors, MCX silver futures and options provide leveraged exposure. The standard MCX silver contract is 30 kilograms, which at today’s rate represents a notional value of approximately 71.3 lakh rupees. Retail investors with a smaller appetite can use MCX’s mini silver contract of 5 kilograms. Both require a commodities trading account with a SEBI-registered broker.
One frequently asked question is whether there is an equivalent to the Sovereign Gold Bond for silver. The answer is no. The Government of India offers Sovereign Gold Bonds that pay 2.5 percent interest per year in addition to gold price appreciation and are exempt from capital gains tax on redemption at maturity. No comparable Sovereign Silver Bond scheme exists as of September 2026.
GST and Import Duty on Silver in India
The price a retail consumer pays for silver in India is the product of three layered levies applied to the international price.
First, import duty at 15 percent is applied to the cost, insurance, and freight value of silver imported into India. The import duty on silver was raised from 10 percent to 15 percent in the Union Budget of 2023, making India’s effective landed cost for silver among the highest in the major consuming nations. This duty is borne by importers, large bullion banks and trading houses, before the metal enters the domestic supply chain.
Second, the IBJA benchmark rate, published each business day morning, reflects the international price converted at the prevailing USD/INR rate and adjusted for import duty, refining charges, and domestic market premiums. It is the wholesale trade’s agreed reference price.
Third, GST at 3 percent is levied on the sale of silver articles, including coins, bars, and jewellery, at the point of retail transaction. The 3 percent rate applies uniformly across India and covers 999 fine silver, 925 sterling, and all other purity grades. Making charges on silver jewellery attract 5 percent GST separately.
A practical calculation for a consumer buying 100 grams of 999 silver in Delhi on 3 September 2026: base rate from IBJA is 23,779 rupees for 100 grams. GST at 3 percent adds 713 rupees. Total outgo is approximately 24,492 rupees.
Global Silver Supply — Top Producing Countries
According to data published by The Silver Institute and GFMS, global silver mine production in 2025 was approximately 832 million troy ounces, close to the record set in 2016.
Country
2025 Production (Moz)
Global Share (%)
Mexico
172.9
20.8%
Peru
131.0
15.7%
China
113.0
13.6%
Russia
50.0
6.0%
Chile
50.0
6.0%
Australia
49.0
5.9%
Bolivia
45.0
5.4%
Rest of World
221.1
26.6%
Source: The Silver Institute / GFMS World Silver Survey 2026. Production figures are for 2025, the most recent full year available.
Mexico has been the world’s largest silver producer since 2009. Most of the world’s silver, roughly 70 percent, is produced as a by-product of the mining of other metals including zinc, lead, copper, and gold. This by-product structure means that silver mine supply is relatively inelastic: miners cannot easily ramp up silver output in response to a price spike, because the output is determined by how much zinc or lead they want to produce. Mexico’s Fresnillo and Peru’s Antamina are among the most significant silver operations globally.
Global Silver Demand Breakdown
Demand Segment
2024 Demand (Moz)
Share (%)
2026 Trend
Industrial (total)
680.5
60.3%
Growing; solar and EV sectors leading
— Solar panels
~197
17.5%
Record growth; 29% of total industrial
— EVs and Electronics
~170
15.1%
25-50g per vehicle; accelerating
Jewellery
170.0
15.1%
Stable; India and China lead consumption
Investment
200.0
17.7%
ETF inflows recovering in 2026
Silverware
55.0
4.9%
Flat to declining
Photography
20.0
1.8%
Long-term secular decline
Other
3.1
0.3%
Dental, mirrors, catalysts
Source: The Silver Institute World Silver Survey. 2024 data is the most recent full year. 2026 trends are directional based on H1 2026 data.
Industrial demand accounted for a record 680.5 million ounces in 2024, driven primarily by solar photovoltaic manufacturing. Each solar panel requires approximately 0.5 to 0.6 grams of silver for its electrical contacts, and global solar installations broke another record in 2025. The International Energy Agency projects that solar demand for silver could reach 300 million ounces annually by 2030 if installation targets are met. Electric vehicles are a secondary but fast-growing driver: the average EV contains between 25 and 50 grams of silver in its electronics, battery management system, and charging infrastructure, compared with 15 to 28 grams in a conventional internal combustion engine vehicle.
Silver vs Gold in India — Comparison Table
Metric
Silver
Gold
Notes
Price per gram (Rs)
237.79
15,478
3 Sep 2026, ex-GST
Price per 10g (Rs)
2,378
1,54,780
24K gold, IBJA basis
Gold/Silver ratio
~65.1 (India domestic)
Mid-range; neither cheap nor expensive vs gold
YTD return (2026)
+10.6%
~+8.0%
Silver outperforming gold year-to-date
5-yr return (from Jan 2021)
~+224%
~+85%
Silver dramatically outperformed over cycle
Volatility
High (3-4x gold)
Moderate
Silver swings are sharper in both directions
Industrial demand share
~60%
~10%
Silver far more industrially driven than gold
India import duty
15%
15%
Both raised to 15% in Budget 2023
GST rate (coins/bars)
3%
3%
Same treatment under GST framework
Sources: IBJA (3 Sep 2026), SEBI, Finance Ministry. 5-yr return is approximate, point-to-point, not annualised.
The gold-to-silver ratio stands at approximately 65.1 using Indian domestic prices on 3 September 2026, calculated as the 24K gold price per gram of 15,478 rupees divided by the silver price per gram of 237.79 rupees. Historically, this ratio has averaged between 50 and 80 over multi-decade periods. A ratio above 80 has often been interpreted as silver being undervalued relative to gold; a ratio below 40 has historically preceded silver corrections. The current level of 65 sits in the middle of the historical range.
For investors comparing gold and silver from the gold rate as of 2 September context, silver’s higher industrial exposure means it tends to outperform gold in periods of economic expansion and underperform in pure risk-off episodes. In 2026 year-to-date, silver has edged ahead by roughly 2.6 percentage points, reflecting the intersection of geopolitical safe-haven demand and resilient industrial demand.
Silver Price Outlook — Technical Levels and Analyst Views
Having corrected approximately 34 percent from its January 2026 all-time high of $121.64 per ounce, silver enters September in territory that technical analysts variously describe as a base-building phase or a continuation of the correction, depending on whether the Federal Reserve delivers the rate hike signalled by Chair Warsh at Jackson Hole.
The immediate technical picture for COMEX silver on 3 September shows support in the $65.00 to $66.50 range, the zone that arrested the August decline, and resistance at $69.00, the level from which sellers emerged on four separate occasions between July and August 2026. A sustained close above $69 would signal that the correction has ended; a break below $65 would reopen the question of whether the $58 to $60 range seen in May 2026 comes back into play.
On the MCX, the corresponding levels are 2,24,000 to 2,28,000 per kilogram as support and 2,44,000 to 2,48,000 as resistance. The September 3 rate of 2,37,790 sits in the middle of this band.
The key variable for the fourth quarter of 2026 is the Federal Reserve. If Warsh delivers a September rate hike, which futures markets put at roughly 55 to 60 percent probability as of this morning, the dollar is likely to strengthen further and silver may revisit its August lows. If the Fed holds, the combination of dollar weakness, recovering industrial demand, and seasonally stronger jewellery demand from India’s festive quarter from Navratri through Diwali could push silver back toward 2,60,000 per kilogram by October. What remains unresolved is the Iranian situation: a meaningful de-escalation could remove additional safe-haven premium from both metals, while any re-escalation would push them sharply higher.
Frequently Asked Questions — Silver Rate Today September 3, 2026
What is the silver rate today in India?
The IBJA benchmark silver rate in India on 3 September 2026 is 2,37,790 per kilogram (ex-GST) for 999-purity fine silver. In smaller denominations: 237.79 per gram, 2,378 per 10 grams, and 23,779 per 100 grams. Retail buyers pay an additional 3 percent GST on top of these rates, bringing the 10-gram consumer price to approximately 2,449 rupees.
What is the MCX silver price today?
MCX silver near-month futures are trading at approximately 2,38,400 per kilogram on 3 September 2026, up 0.82 percent from Tuesday’s settlement. MCX trades continuously from 9:00 AM to 11:30 PM IST; the price updates in real time throughout the session and is accessible via the MCX website or any SEBI-registered commodity broker platform.
What is the international silver price today?
International spot silver is trading at $67.41 per troy ounce on 3 September 2026, a gain of 5.12 percent from the previous session’s close of $64.13. COMEX silver futures for December 2026 delivery are at $67.75 per ounce. The London Bullion Market Association (LBMA) reference price will be published later in the day.
Why is the silver rate different across Indian cities?
The IBJA benchmark is a national wholesale rate set in Mumbai. City-level retail rates vary by a small margin, typically 10 to 20 rupees per 10 grams, owing to freight costs from the primary Mumbai hub, local dealer margins, and demand-supply dynamics within each state’s jewellery trade. South Indian cities such as Chennai and Kochi tend to carry a small premium over Delhi owing to higher jewellery consumption and slightly higher logistics costs.
How is the silver price in India calculated from the international rate?
The calculation proceeds in four steps. First, convert the international spot price from USD per troy ounce to rupees per gram using the prevailing USD/INR exchange rate. Second, add 15 percent import duty. Third, add the IBJA margin and dealer premium to arrive at the wholesale benchmark. Fourth, add 3 percent GST for retail buyers. On 3 September 2026, this produces a retail price of approximately 244.9 rupees per gram or 2,449 rupees per 10 grams.
Is today a good time to buy silver?
This article provides market data and educational information and does not constitute investment advice. Readers should consult a SEBI-registered financial adviser before making investment decisions. Silver on 3 September 2026 is trading approximately 34 percent below its January 2026 all-time high. Industrial demand from solar and EV sectors continues to grow. The near-term direction depends heavily on the Federal Reserve’s September rate decision and the trajectory of US-Iran tensions.
What factors affect silver prices in India?
Six primary factors influence the domestic silver rate: international spot price on COMEX and LBMA; USD/INR exchange rate; import duty (currently 15 percent); GST (3 percent on retail transactions); domestic demand from jewellery and silverware trade; and MCX futures market activity from institutional traders and hedgers. Industrial demand trends from solar and EV manufacturing are increasingly influential as a structural driver of the international price.
What is the silver rate per gram today?
The silver rate per gram on 3 September 2026 is 237.79 rupees ex-GST, or approximately 244.90 rupees including 3 percent GST, for 999-purity silver based on the IBJA benchmark. Prices may differ at individual retail dealers depending on their margins and the city of purchase.
What is GST on silver in India?
GST on silver, including silver coins, silver bars, and silver jewellery, is 3 percent, levied at the point of retail sale. Making charges on silver jewellery attract an additional 5 percent GST separately from the metal value. There is no GST on Silver ETF unit purchases on stock exchanges; the tax is embedded in the ETF’s underlying asset NAV at the time of physical silver acquisition by the fund.
What is the purest form of silver?
Fine silver 999, also called three-nines fine, at 99.9 percent purity is the purest commercially available silver. Investment-grade silver bars and silver ETFs hold 999 fine silver. The BIS hallmark code S999 certifies this purity grade in India. For practical purposes, 999 is considered pure silver; the 0.1 percent residual consists of trace amounts of copper, gold, or other elements that are commercially negligible.
How is silver price determined in India?
The silver price in India is determined by two mechanisms. The IBJA sets a benchmark once per business day based on international market prices from London and COMEX, the prevailing USD/INR rate, and a domestic supply-demand adjustment; it is the reference rate for wholesale transactions. MCX provides continuous intraday price discovery through exchange-traded futures contracts used by institutional hedgers and traders. The two rates are closely correlated, with MCX typically leading and IBJA following by a few hours each morning.
Is silver a good investment in 2026?
Silver has returned approximately 10.6 percent year-to-date in 2026, modestly ahead of gold at roughly 8 percent. Its industrial demand from solar and EV sectors provides a structural demand floor that pure monetary metals lack. However, silver is substantially more volatile than gold: swings of 5 to 10 percent in a single session are not uncommon, as today’s 5.12 percent international price move illustrates. For risk-tolerant investors, silver ETFs and MCX contracts offer the most efficient access; for conservative investors, gold’s lower volatility is typically preferred. This is not investment advice.
Sources, Methodology and Disclaimer
Silver rates in this article are sourced from the India Bullion and Jewellers Association (IBJA), the Multi Commodity Exchange of India (MCX), and international reference prices including the COMEX futures market and London Bullion Market Association (LBMA) spot quotations. The USD/INR rate used is 94.30 as per the Reserve Bank of India reference rate for 3 September 2026. City-level rates are based on the IBJA benchmark adjusted for local dealer margins sourced from the dealer network. Global supply and demand data are from The Silver Institute World Silver Survey 2026.
Prices are as of the morning session on 3 September 2026 IST and may have changed by the time of reading. Silver prices fluctuate throughout the trading day on MCX and internationally. The IBJA benchmark is set once per business day; intraday movements are tracked through MCX. All prices are indicative and actual transaction prices may differ based on dealer margins, making charges, and prevailing exchange conditions.
This article is for informational purposes only and does not constitute investment advice, a solicitation to buy or sell silver or any other commodity, or a recommendation of any specific financial product. Readers should consult a SEBI-registered investment adviser before making any investment decision.
Amanda Graham is a journalist at The Eastern Herald covering economic and business developments, current affairs and major developments across the world of sports.