
The S&P 500 does not hold 500 companies. It holds 503. It is not a list of the 500 largest firms in America either, and it never has been. A committee of people at S&P Dow Jones Indices decides who is in it, applying a profitability test that keeps out some of the most valuable private companies in the country the moment they list.
Roughly one dollar in every three that Americans hold in equity funds tracks this index or something built on it. Most of the people who own it could not describe how membership is decided, which is the useful place to start. This page is maintained as a reference and was last updated on August 25, 2026.
| Measure | Value |
|---|---|
| Constituents | 503 companies, 500 in the name |
| Weighting | Free-float market capitalisation |
| Maintained by | S&P Dow Jones Indices, majority owned by S&P Global |
| Launched in current form | March 4, 1957 |
| Index level | 7,669.65 on August 25, 2026, up 0.22% on the session |
| Record high | 7,816.70, set in August 2026 |
| One-year change | +18.62% |
| Trailing P/E | 29.49, against a long-run mean of 16.23 |
| Shiller CAPE | 41.84, against a long-run mean of 17.40 |
| Dividend yield | 1.05%, against a long-run mean of 4.21% |
| Selection | Four eligibility screens, then a committee vote |
| Index level and one-year change: Trading Economics, August 25, 2026. Valuation and yield: multpl, at the close of August 24, 2026. Methodology: S&P Dow Jones Indices. | |
What the S&P 500 actually is
It is a free-float market-capitalisation weighted index of large American companies, maintained by S&P Dow Jones Indices, a joint venture majority owned by S&P Global.
Take each member company, count only the shares actually available to public investors, multiply by the share price, and you have that company’s weight in the index. Add all 503 together and divide by a proprietary number called the divisor, which exists solely to keep the index level continuous when companies join, leave, split or issue stock. That divisor is why the index reads in the thousands rather than the trillions.
Free float matters more than people expect. Shares locked up by founders, governments or strategic holders are stripped out before the weighting is calculated, so the index reflects what an investor could actually buy rather than the full theoretical value of the company.
The count is 503 rather than 500 because several companies have more than one class of listed stock. Alphabet’s A and C shares are counted separately, as are the two classes at Fox and News Corp. The name has stayed at 500 since 1957 for the same reason the FTSE 100 is not renamed every time a merger changes the arithmetic.
A short history of the S&P 500 index
The index is older than its name. Standard Statistics Company built a 233-company index in 1923 and computed it weekly, then a 90-stock version in 1926 that it could compute daily. Those are the ancestors of everything quoted on the evening news today.
The modern index arrived on Monday, March 4, 1957, when the 90 stocks became 500 and the thing was renamed the S&P 500 Stock Composite Index. The Library of Congress records the debut as the first computer-generated index, calculated from electronic punch cards, which is what made an hourly rather than a daily reading possible. The original 500 were 425 industrials, 15 rail companies and 60 utilities, worth $172 billion between them and covering more than 90 per cent of the value of NYSE-listed common stock.
Three later changes matter more than the launch. In 1976 Vanguard opened the first index mutual fund available to ordinary investors and pointed it at this index, which turned a measuring instrument into a product. In 1993 the SPDR S&P 500 ETF made the same exposure tradable through the day and became the first exchange-traded fund listed in the United States. And in 2005 S&P completed the shift to free-float weighting, which quietly reduced the index weight of every company with large blocks of stock held off the market.
$172 billion to $61 trillion
The 1957 index was worth $172 billion. The 503 companies in it at the end of 2025 were worth about $61.1 trillion. Some of that is real growth in American corporate value, some is inflation, and some is simply that more of the economy is listed now than was listed then. The index is not a constant yardstick measuring a growing thing. It is a changing yardstick measuring a changing thing, and the committee changes it.

How a company gets into the S&P 500
Four hurdles, then a vote.
The company must be American, listed on an eligible US exchange. Its unadjusted market capitalisation must clear a threshold that S&P raises periodically, last set at $22.7 billion. More than half its shares must be in public hands. And it must be profitable on an as-reported GAAP basis in its most recent quarter, with the sum of the four most recent quarters also positive.
That last test is the one that decides most arguments. GAAP profitability, not adjusted earnings, not free cash flow, not a promise of profitability. It is why fast-growing loss-making companies can be worth hundreds of billions and still sit outside the index, and why the Nasdaq 100, which applies no profitability screen, often admits them first. Eastern Herald has written about the clearest current example, a company that joined one index within a month of listing and remains ineligible for the other.
| Test | Requirement | Why it exists |
|---|---|---|
| Domicile and listing | US company on an eligible US exchange | Keeps the index a measure of American large caps |
| Size | Unadjusted market capitalisation above a threshold last set at $22.7 billion | Raised periodically so the index tracks the market rather than lagging it |
| Public float | More than half of shares outstanding held by the public | Ensures the index reflects stock investors can actually buy |
| Profitability | Positive as-reported GAAP earnings in the most recent quarter, and positive across the trailing four quarters combined | The screen that most often keeps large loss-making companies out |
| Final step | A vote by the index committee | Eligibility is necessary but not sufficient; sector balance and representativeness also weigh |
| The profitability test uses GAAP net income excluding discontinued operations and extraordinary items, not adjusted or non-GAAP earnings. The Nasdaq 100 applies no equivalent profitability screen, which is why the two indices often admit the same company years apart. | ||
Clearing all four hurdles earns a company consideration, not a place. The index committee meets quarterly, in March, June, September and December, and weighs sector balance and what it calls representativeness alongside the numeric screens. It can add a company outside the schedule when a member is acquired or delisted, and it does so regularly.
This is the fact that distinguishes the S&P 500 from a rules-only index. A machine does not pick it. People do, and they are not obliged to explain a decision.
Market-cap weighting, and the concentration it has produced
Weighting by size means the index buys more of what has already gone up. Over a long enough period that is a feature, because it lets winners compound. Over the last three years it has produced a concentration that has no modern precedent.
At the end of July 2026 the ten largest positions were 37.6 per cent of the index. Merge Alphabet’s two share classes back into one company and the ten largest companies come to 39.1 per cent, with the seven largest alone at 34.7 per cent. The remaining 490-odd companies share what is left.
| Grouping | Share of the index |
|---|---|
| Largest single holding, Nvidia | 7.55% |
| Two largest, Nvidia and Apple | 14.59% |
| Seven largest companies | 34.70% |
| Ten largest index positions | 37.62% |
| Ten largest companies, Alphabet merged | 39.06% |
| The other 490-odd companies combined | 60.94% |
| The same seven in the equal-weighted index | about 1.4% |
| Position weights from the published holdings of a fund tracking the index, July 31, 2026. Company-level totals and the equal-weight figure are Eastern Herald calculations; in the equal-weighted version every member carries roughly 0.2 per cent. | |
The practical consequence is that an investor who believes they hold a diversified slice of corporate America holds something closer to a large technology position with a broad hedge attached. The equal-weighted version of the same index, which gives every member the same 0.2 per cent, cuts the seven from roughly a third of the portfolio to 1.4 per cent. The gap between how those two versions perform in any given month is the cleanest available measure of how narrow the market has become, and it shows up in the sector splits on an ordinary trading day.
The biggest S&P 500 companies
Nvidia is the largest position in the index and Apple is second, and between them they are more than one dollar in seven of the whole thing. That is a fact about semiconductors and phones, not about the American economy.
| Rank | Company | Ticker | Weight |
|---|---|---|---|
| 1 | Nvidia | NVDA | 7.55% |
| 2 | Apple | AAPL | 7.04% |
| 3 | Alphabet | GOOGL and GOOG | 5.86% |
| 4 | Microsoft | MSFT | 5.36% |
| 5 | Amazon | AMZN | 4.13% |
| 6 | Broadcom | AVGO | 2.86% |
| 7 | Meta Platforms | META | 1.90% |
| 8 | JPMorgan Chase | JPM | 1.46% |
| 9 | Berkshire Hathaway | BRK.B | 1.46% |
| 10 | Micron Technology | MU | 1.44% |
| Ten largest combined | 39.06% | ||
| Weights from published fund holdings as of July 31, 2026. Alphabet’s A and C share classes are separate index members, at 3.24 and 2.62 per cent, and are shown here combined. Ranking is by company rather than by index line item, so it differs from a raw holdings list. | |||
Two features of that table are worth pausing on. Alphabet appears twice, at 3.24 and 2.62 per cent, because its A and C shares are separate index members; treated as one company it is the third largest holding at 5.86 per cent. And the eleventh position, just outside the table, is a memory-chip maker that crossed a trillion dollars of market value in May 2026, which is a reasonable illustration of how quickly the top of this index now reorders itself.
The composition also explains why single-company news moves the whole index. When one chipmaker’s product launch pushed the S&P 500 to a record in June 2026, that was not sentiment. A 7.5 per cent weight moving 5 per cent moves the index roughly 0.4 per cent on its own, before anything else trades.
S&P 500 sectors: what the index is actually made of
Concentration by company is one lens. Concentration by sector is the other, and it tells the same story in a form more people can act on.
The S&P 500 is divided into eleven sectors under the Global Industry Classification Standard, and they are nothing like equal. Technology alone is more than a third of the index. Add financials and consumer discretionary and three sectors account for sixty per cent of it. At the other end, materials is under one per cent, which means the entire American chemicals, mining and packaging complex carries less weight in the S&P 500 than a single one of the seven largest companies.
| Sector | Weight | Running total |
|---|---|---|
| Technology | 36.1% | 36.1% |
| Financials | 12.5% | 48.6% |
| Consumer Discretionary | 11.4% | 60.0% |
| Healthcare | 9.3% | 69.3% |
| Communication Services | 9.3% | 78.6% |
| Industrials | 8.8% | 87.4% |
| Consumer Staples | 4.2% | 91.6% |
| Energy | 3.0% | 94.6% |
| Utilities | 2.7% | 97.3% |
| Real Estate | 1.7% | 99.0% |
| Materials | 0.9% | 99.9% |
| The remaining 0.1 per cent sits in holdings outside the tracked price universe. Sector weights differ between data providers depending on how companies straddling technology and communication services are mapped, and some published breakdowns put technology nearer 29 to 30 per cent on a narrower definition. The running-total column is Eastern Herald’s calculation. | ||
This matters for anyone who thinks they are diversifying by buying the index and then buying a technology fund alongside it. They are buying the same thing twice. It matters in the other direction too: an investor who wants exposure to energy or utilities gets almost none of it here, and the eleven-sector split is the quickest way to see that before rather than after.
Sector weights also move faster than people expect. Technology was under a fifth of the index in the early 2010s. Financials were the largest sector before 2008 and have never returned to that position.
S&P 500 vs the Dow and the Nasdaq
Four indices get quoted on the evening news and they measure different things.
| Index | Members | Weighting | Profitability screen |
|---|---|---|---|
| S&P 500 | 503 | Free-float market capitalisation | Yes, as-reported GAAP |
| Dow Jones Industrial Average | 30 | Share price | No formal screen |
| Nasdaq 100 | 100 | Modified market capitalisation | No |
| Nasdaq Composite | About 3,000 | Market capitalisation | No |
| The Dow and the S&P 500 are both maintained by S&P Dow Jones Indices and both are committee-selected, but the Dow weights by share price, so a $500 stock moves it more than a $50 stock regardless of company size. The two Nasdaq indices are defined by listing venue rather than by any judgment about which companies belong. | |||
The Dow Jones Industrial Average is the oldest and the least representative. Thirty companies, weighted by share price rather than company size, which produces the strange result that a stock trading at $500 moves the index ten times as hard as one at $50 no matter which is the larger business. Eastern Herald’s coverage of a single session in which one bank supplied 44 per cent of a 518-point move is the mechanism in miniature.
The two Nasdaq indices are defined by where a company is listed rather than by any view on whether it belongs. The Nasdaq Composite holds roughly 3,000 companies and the Nasdaq 100 holds the largest hundred of them, and neither applies a profitability test. That single difference is why a company can sit in one index for years before the S&P 500 committee will look at it, and why the question of which Nasdaq you are watching is not pedantry.
The S&P 500 sits between them: broad enough to be representative, gated enough to be selective, and judged by people rather than by a rule.
S&P 500 performance and historical returns
The index last traded at 7,669.65, up 0.22 per cent on the session and about 1.9 per cent below the record of 7,816.70 it set earlier this month. It is up 3.5 per cent over the past month and 18.6 per cent over the past year.
Those are the numbers on the screen, and the futures curve built on top of them carries its own information about the cost of money. The number that matters for anyone holding the index for a working lifetime is the long-run average, which has run near 10 per cent a year nominally since 1957, before inflation and before fees. Strip out inflation and the real figure is closer to 7 per cent.
Neither average describes any actual year. The average is an arithmetic artefact of a series that almost never lands on it, and the years it misses by the widest margin are the ones that decide whether an investor stays invested.
The gap between price return and total return
Almost every headline S&P 500 number is a price return, which ignores dividends. Over one day that distinction is noise. Over thirty years it is most of the money. The difference between the two series is the single most common source of confusion in retail investing, and it is worth checking which one a chart is showing before drawing a conclusion from it.
When the S&P 500 has fallen
The average conceals four occasions this century when the index lost a fifth or more of its value.
| Period | Trigger | Decline |
|---|---|---|
| March 2000 to October 2002 | Dot-com collapse | About 49 per cent |
| October 2007 to March 2009 | Global financial crisis | About 57 per cent |
| February to March 2020 | Covid, in 32 days | About 34 per cent |
| January to October 2022 | Rate shock | 25.4 per cent |
| Price index, excluding dividends. Each of these was followed by a recovery to a new high, which is the argument for holding through them, but the 2007 peak was not regained until 2013. An investor who needed the money in 2009 did not get the average. | ||
The pattern people take from that table is that every fall was recovered. That is true and it is also the most dangerous sentence in personal finance, because recovery is measured from the trough rather than from the peak, and the time taken is the part that hurts. An investor who bought at the October 2007 high waited until 2013 to break even in price terms. Anyone who needed the money in between did not get the long-run average. They got 2009.
A correction, conventionally a fall of 10 per cent from a high, happens far more often than the table suggests and usually resolves within months. A bear market, a fall of 20 per cent, is what the table records. Recessions are a third thing again: the index has fallen hard without a recession, in 1987 and 2022, and has risen through the back half of several recessions because it is pricing the recovery rather than the present.
S&P 500 dividends and the shrinking yield
The S&P 500 yields about 1.05 per cent. Its long-run mean is 4.21 per cent and its median is 4.19 per cent, which means the current payout sits at roughly a quarter of what an investor in this index has historically been paid to wait.
Two things drove that down and only one of them is alarming. Prices rose faster than dividends, which mechanically compresses the yield. And American companies shifted decisively from dividends to buybacks after the 1982 rule change that made repurchases safe from manipulation charges, so a growing share of shareholder return now arrives as a smaller share count rather than as cash. A buyback is economically similar to a dividend and is taxed differently, which is most of why it won.
The consequence for anyone using the index as an income source is blunt. At 1.05 per cent, a million dollars in the S&P 500 pays about $10,500 a year before tax. Thirty years ago the same holding would have paid several times that in real terms. The index has become an instrument for capital appreciation that happens to pay a small dividend, and the retirement arithmetic people learned in the 1990s no longer applies to it.
S&P 500 valuation: what the index costs right now
This is the section that dates fastest and matters most, so the figures below carry the date of their reading rather than a vague “currently”.
| Measure | Now | Long-run mean | Extreme on record |
|---|---|---|---|
| Trailing P/E, as-reported | 29.49 | 16.23 | 123.73 in May 2009 |
| Shiller CAPE | 41.84 | 17.40 | 44.19 in December 1999 |
| Dividend yield | 1.05% | 4.21% | 13.84% in June 1932 |
| Earnings yield | 3.39% | 7.20% | 0.81% in May 2009 |
| 10-year Treasury yield | 4.70% | 4.48% | 15.32% in September 1981 |
| Equity risk premium | -1.31 pp | positive | n/a |
| Source: multpl, at the close of August 24, 2026. The equity risk premium row is the earnings yield minus the 10-year Treasury yield and is Eastern Herald’s calculation. A trailing P/E of 123.73 in May 2009 reflects collapsed earnings rather than expensive stocks, which is why the cyclically adjusted measure exists. | |||
The trailing price-to-earnings ratio is 29.49 against a long-run mean of 16.23. That is roughly 82 per cent above average, which sounds damning until you remember that the composition of the index has shifted toward businesses with higher margins and lower capital needs, and those businesses have always commanded higher multiples. A software company is not a railway.
The cyclically adjusted measure is harder to explain away. The Shiller CAPE ratio, which divides price by ten years of inflation-adjusted earnings precisely to strip out that kind of argument, reads 41.84. Its long-run mean is 17.40 and its all-time high is 44.19, set in December 1999. The index is currently within about 5 per cent of the most expensive equity market in American history by that measure.
The number that should worry people more than the P/E
The S&P 500 earnings yield, which is simply the P/E turned upside down, is 3.39 per cent. The 10-year Treasury pays 4.70 per cent. An investor buying the index today is accepting about 131 basis points less than the risk-free rate in exchange for taking equity risk.
That is a negative equity risk premium, and it is not a normal state of affairs. For most of the last fifty years stocks paid a premium over Treasuries precisely because they can fall by half. The market is currently pricing the opposite, which is only rational if earnings are about to grow fast enough to close the gap, or if long rates are about to fall. The second of those is the bet most of the money is making, and the Federal Reserve has spent five consecutive meetings declining to validate it.
The Federal Reserve, inflation and interest rates
The single largest external input into the S&P 500’s price is the cost of money, and it has not moved since March.
| Input | Reading | Direction |
|---|---|---|
| Federal funds target | 3.50% to 3.75% | Held for a fifth consecutive meeting in July 2026 |
| Dissents at the July meeting | Three, all for a 25bp increase | No member dissented for a cut |
| Annual CPI inflation | 3.4% in July 2026 | Eased from 3.5% in June, second consecutive fall |
| Gasoline, year on year | Up 24.6% | Down from 26.7% in June as the energy shock eases |
| 10-year Treasury | 4.70% | Close of August 24, 2026 |
| Fed inflation target | 2.0% | Current inflation is 70% above it |
| Rate and inflation data: Trading Economics summaries of Federal Reserve and Bureau of Labor Statistics releases, July 2026. Treasury yield: multpl, August 24, 2026. The 70 per cent figure is Eastern Herald’s calculation. | ||
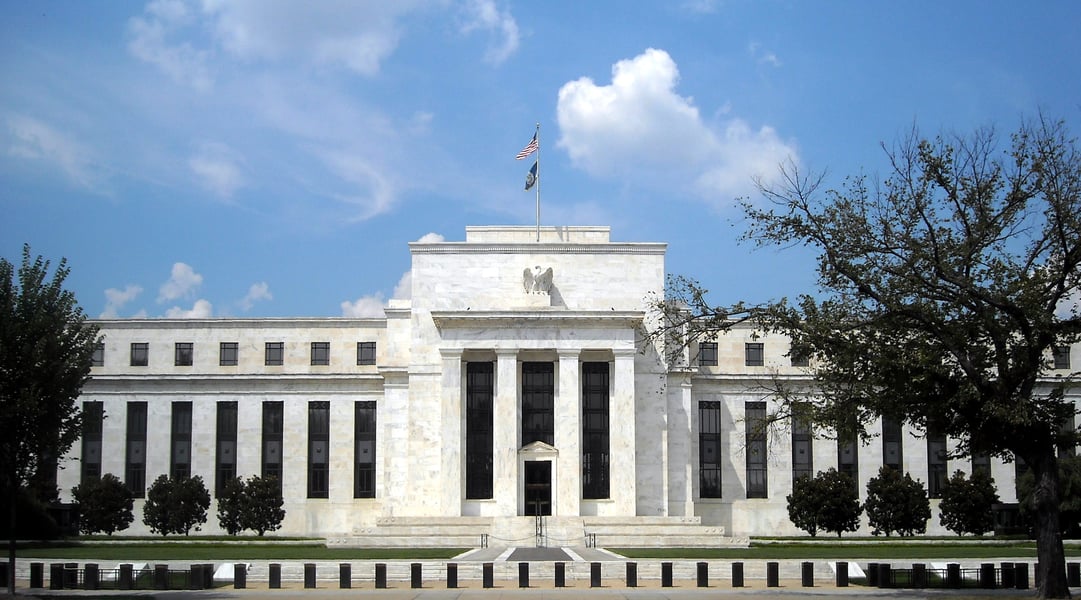
The Fed left the federal funds rate at 3.50 to 3.75 per cent in July 2026, a fifth consecutive hold, and three members of the committee dissented in favour of a 25 basis point increase. Not a cut. An increase. Markets had assigned roughly a one-in-three probability to a hike going into that meeting, and the divided decision took 1,100 points off the Dow in a session. The Federal Reserve’s own meeting calendar is the place to check what is scheduled next rather than what is rumoured.
Annual inflation was 3.4 per cent in July, easing for a second month from 3.5 per cent in June, with the energy shock from the war with Iran still working its way out of the numbers. Gasoline was up 24.6 per cent year on year. That is well below the 4.2 per cent peak of 2023 and still seventy per cent above the Fed’s 2 per cent target, which is the arithmetic behind those three dissents.
Why a rate cut matters more to this index than to most
A high-multiple, long-duration index is more sensitive to discount rates than a cheap one, because more of its value sits in cash flows a decade or more away. That is why the same 25 basis points that barely move a utility can move a technology-heavy benchmark several per cent. It is also why the index has managed to reach records on inflation data rather than growth data: a flat producer price print in July pushed the S&P 500 to a record even as core wholesale inflation climbed underneath it.
The gold market is currently pricing the same tension from the other side, and it is worth reading the two together. Gold hit a fifteen-week high going into a Jackson Hole meeting where a rate rise is live, which is not how the asset usually behaves ahead of tighter policy.
Recessions, corrections and geopolitical risk
The index has a war in it and has spent 2026 mostly ignoring it.
The conflict with Iran raised energy prices, pushed headline inflation up and delayed the rate cuts the equity market had been priced for, all of which are unambiguously negative for a benchmark trading at 29 times earnings. It has still risen 18.6 per cent over the year. That is not irrational on its face: two-thirds of the index by weight sells software, semiconductors, advertising and cloud capacity, none of which is priced in barrels. But it does mean the index is expressing a view that the war is contained, and there is no way to hedge that view inside the index itself.
Eastern Herald has written about the contradiction directly: a market making records on the assumption of cheaper money while the data that would deliver cheaper money keeps failing to arrive. The resolution is either a soft landing that justifies the multiple, or a repricing. Nothing on this page can tell you which, and the honest position is that the people running the largest funds do not agree with each other either.
How to own the S&P 500: index funds and ETFs
You cannot buy the index. You buy a fund that tracks it, and the differences between the main options are smaller than the marketing suggests.
Three exchange-traded funds dominate. SPDR’s SPY, launched in January 1993, was the first exchange-traded fund listed in the United States and remains the most heavily traded, which makes it the instrument of choice for anyone who needs to move size quickly or trade options against it. It also charges the most, at 0.0945 per cent. BlackRock’s IVV and Vanguard’s VOO both charge 0.03 per cent.
| Fund | Ticker | Annual fee | Cost per $10,000 a year | Launched |
|---|---|---|---|---|
| SPDR S&P 500 ETF Trust | SPY | 0.0945% | $9.45 | January 1993 |
| iShares Core S&P 500 ETF | IVV | 0.03% | $3.00 | 2000 |
| Vanguard S&P 500 ETF | VOO | 0.03% | $3.00 | 2010 |
| Invesco S&P 500 Equal Weight ETF | RSP | 0.20% | $20.00 | 2003 |
| SPY was the first exchange-traded fund listed in the United States and still trades in the greatest volume, which matters for large or options-based positions rather than for buy-and-hold investors. RSP tracks the same 503 companies weighted equally rather than by market value, so it is a different portfolio and not a cheaper route to the same exposure. | ||||
On a $10,000 holding the difference between SPY and the other two is $6.45 a year. That is trivial for a trader and meaningful for someone holding for thirty years, which is roughly the split in who uses which.
The equal-weighted alternative charges 0.20 per cent, and the extra cost buys a genuinely different portfolio rather than a slightly cheaper version of the same one. Whether that is worth paying nearly seven times as much for depends entirely on a view about concentration, which is a view about the top ten holdings, which brings the question back to the table further up this page.
Index funds against ETFs
A traditional index mutual fund and an ETF tracking the same index will deliver nearly identical returns. The ETF trades through the day and is usually more tax-efficient in a taxable US account because of how in-kind redemptions work. The mutual fund prices once, at the close, and accepts fractional dollar amounts more easily, which suits automatic monthly contributions. For a long-term holder in a tax-sheltered account the choice is close to irrelevant, and anyone telling you otherwise is selling something.
S&P 500 forecast: what can and cannot be said
No honest page forecasts an index. What can be published is what specific models currently output, attributed and dated, so a reader can judge the source rather than the number.
| Horizon | Model output | Change from 7,669.65 |
|---|---|---|
| End of current quarter | 7,603.20 | -0.9% |
| Twelve months out | 7,038.16 | -8.2% |
| Source: Trading Economics global macro models and analyst expectations, August 25, 2026. These are statistical extrapolations, not an Eastern Herald view and not a consensus of analyst targets, which generally sit higher. Percentage changes are Eastern Herald’s calculation against the August 25 level. No projection of an equity index should be read as a prediction. | ||
Trading Economics’ global macro model, which is a statistical extrapolation rather than an analyst view, puts the index at 7,603.20 by the end of this quarter and 7,038.16 in twelve months. That second figure is roughly 8 per cent below the current level, and it is worth being explicit that it comes from a model with no opinion about earnings, the Fed or Iran. Sell-side year-end targets published by the large banks generally sit above the current level, because they generally do.
The useful frame is not a point estimate. It is the two questions the sections above have already raised: whether earnings can grow into a 29 times multiple, and whether long rates fall far enough to make a 3.39 per cent earnings yield rational against a 4.70 per cent Treasury. Every forecast worth reading is an answer to those two questions wearing a number as a disguise.
What the index does not tell you
It is not the American economy.
The S&P 500 measures the market value of 503 listed companies, which employ a minority of American workers and increasingly earn a large share of their revenue abroad. Private companies, which is where a growing share of corporate value now sits, are absent by definition. Small businesses are absent. So is anything the committee has not admitted.
The index also cannot tell you what it will do next, and the honest limit of any page like this one is that the historical average return is a description of the past rather than a forecast. The concentration described above is either the market correctly identifying which companies will dominate the next decade, or the largest single-sector bet the index has ever carried into a downturn. Nobody writing today knows which, and anyone who says otherwise is selling something.
Last updated
This page was last updated on August 25, 2026. Index level, valuation ratios, dividend yield and Treasury yields are dated to the readings shown in the tables above and go stale quickly; the methodology, history and eligibility sections change rarely. Constituent weights are as of July 31, 2026, the most recent published holdings date. Where a figure is a model output rather than a measurement, the table says so.
The S&P 500 is a stock market index of 503 large American companies, weighted by free-float market capitalisation and maintained by S&P Dow Jones Indices. It is not a ranking of the 500 biggest US firms: a committee selects members after applying four eligibility screens, including a test of as-reported GAAP profitability.
There are 503 index members representing 500 companies. The extra three exist because several companies, including Alphabet, Fox and News Corp, have more than one class of listed stock and each class is counted separately.
The index last traded at 7,669.65 on August 25, 2026, up 0.22 per cent on the session and about 1.9 per cent below its record high of 7,816.70 set earlier that month. It was up 3.5 per cent over the month and 18.6 per cent over the year.
The record close is 7,816.70, set in August 2026.
As of July 31, 2026 the largest holdings were Nvidia at 7.55 per cent, Apple at 7.04 per cent, Alphabet at 5.86 per cent across both share classes, Microsoft at 5.36 per cent and Amazon at 4.13 per cent. The ten largest companies together are about 39 per cent of the index.
Eleven, under the Global Industry Classification Standard: technology, financials, consumer discretionary, healthcare, communication services, industrials, consumer staples, energy, utilities, real estate and materials. Technology is more than a third of the index and materials is under one per cent.
The long-run average has run near 10 per cent a year nominally since 1957, or closer to 7 per cent after inflation, before fees. No individual year looks like that average, and the index has fallen more than 20 per cent four times this century.
The trailing as-reported price-to-earnings ratio was 29.49 at the close of August 24, 2026, against a long-run mean of 16.23. The cyclically adjusted Shiller CAPE ratio was 41.84, against a mean of 17.40 and an all-time high of 44.19 set in December 1999.
About 1.05 per cent, roughly a quarter of the long-run mean of 4.21 per cent. Prices have risen faster than dividends and American companies have shifted much of their shareholder return into share buybacks, which do not show up in the yield.
There is no single best one. IVV and VOO both charge 0.03 per cent a year and suit long-term holders. SPY charges 0.0945 per cent but trades in far greater volume, which matters for large positions and options. RSP charges 0.20 per cent and holds the same companies equally weighted, which is a genuinely different portfolio rather than a cheaper version of the same one.
Through the discount rate applied to future earnings. The Fed held the federal funds target at 3.50 to 3.75 per cent for a fifth consecutive meeting in July 2026, with three members dissenting in favour of an increase. A high-multiple index is more sensitive to rate expectations than a cheap one, because more of its value sits in cash flows a decade or more away.
By historical measures it is expensive: a trailing P/E 82 per cent above its long-run mean, and a CAPE ratio within about 5 per cent of the December 1999 record. The earnings yield of 3.39 per cent is also below the 4.70 per cent paid by 10-year Treasuries, which is an unusual state of affairs. Whether that is justified depends on future earnings growth and interest rates, which nobody knows.
No honest source forecasts an index. Trading Economics’ statistical model published on August 25, 2026 put the index at 7,603.20 by the end of the quarter and 7,038.16 in twelve months, which would be about 8 per cent below the current level. That is a model extrapolation, not an analyst consensus, and sell-side year-end targets generally sit higher.
No. It measures the market value of 503 listed companies, which employ a minority of American workers and earn a large and growing share of their revenue abroad. Private companies and small businesses are absent by definition.